Fig. 4
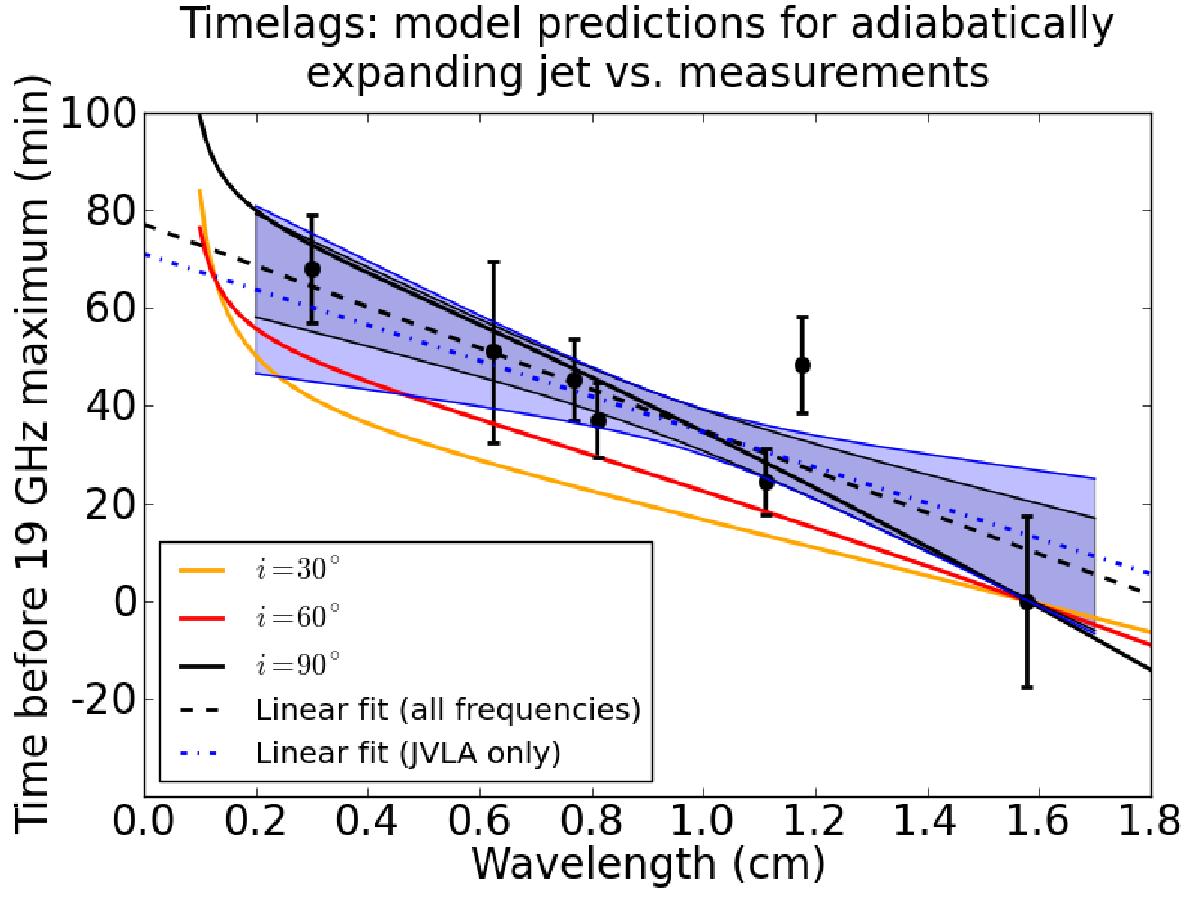
Fitted times for the flux density maxima in each baseband (relative to the 19 GHz (1.6 cm) maximum), plotted as a function of observing wavelength. The figure uses the errors on the fit maxima obtained from fitting all data points. Dark shaded regions indicate the uncertainty in fit slope using all light curves, lighter shaded regions indicate the uncertainty in fit slope from VLA light curves alone. The slopes obtained are 42 ± 14 min/cm (all data) and 36 ± 21 min/cm (VLA data alone). The continuous lines are time-lag predictions from the jet model by Falcke et al. (2009) assuming inclinations of 30, 60, and 90°.
Current usage metrics show cumulative count of Article Views (full-text article views including HTML views, PDF and ePub downloads, according to the available data) and Abstracts Views on Vision4Press platform.
Data correspond to usage on the plateform after 2015. The current usage metrics is available 48-96 hours after online publication and is updated daily on week days.
Initial download of the metrics may take a while.