Fig. 2
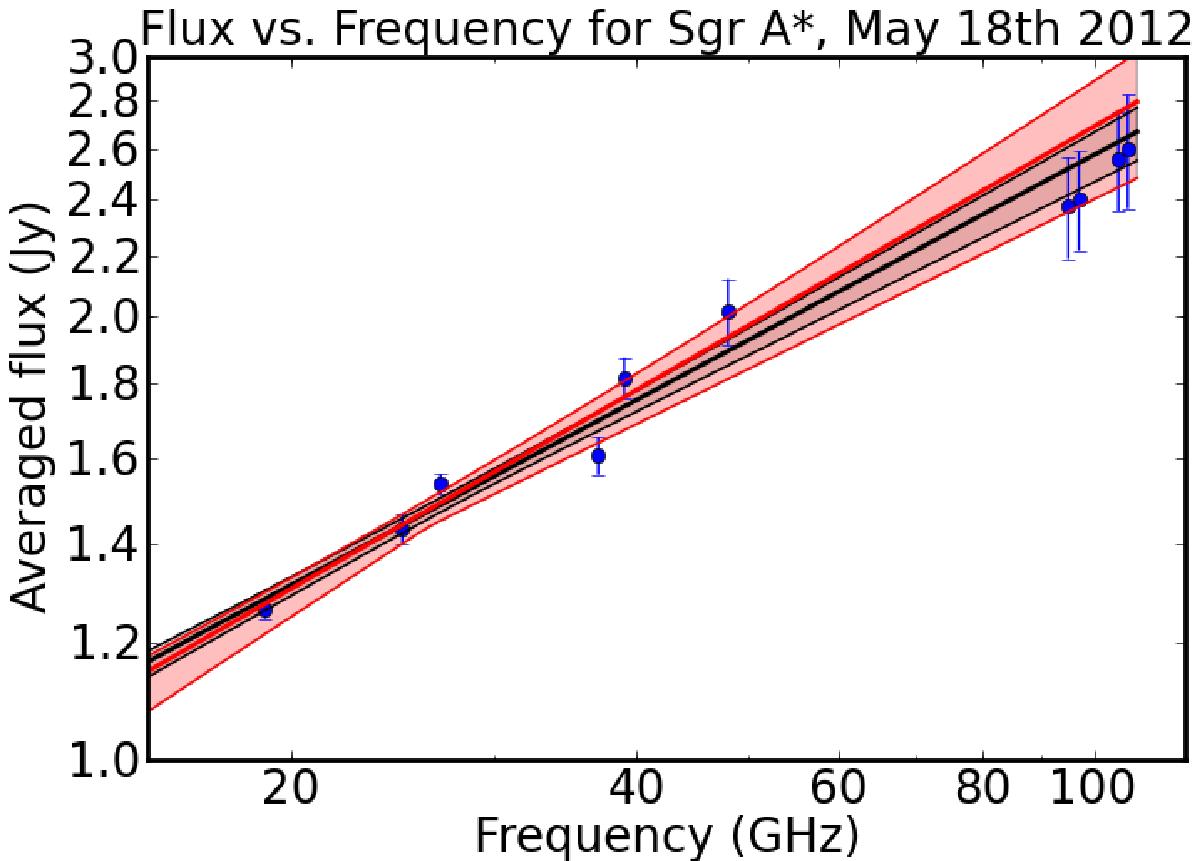
Averaged flux density as a function of frequency for all light curves for the time period between 7 h and 11 h UT. The error bars denote measurement error convolved with flux density variability over the track, where variability is the dominant contribution. Variability is strongest at the highest frequencies. The spectral index obtained from using VLA + ALMA data is indicated by the black line (with 1sigma fit uncertainties filled in with gray) and yields α = 0.42 ± 0.03. Using the VLA data only (red/gray line, with red/light gray 1sigma uncertainty region), α = 0.45 ± 0.07.
Current usage metrics show cumulative count of Article Views (full-text article views including HTML views, PDF and ePub downloads, according to the available data) and Abstracts Views on Vision4Press platform.
Data correspond to usage on the plateform after 2015. The current usage metrics is available 48-96 hours after online publication and is updated daily on week days.
Initial download of the metrics may take a while.