Fig. 9
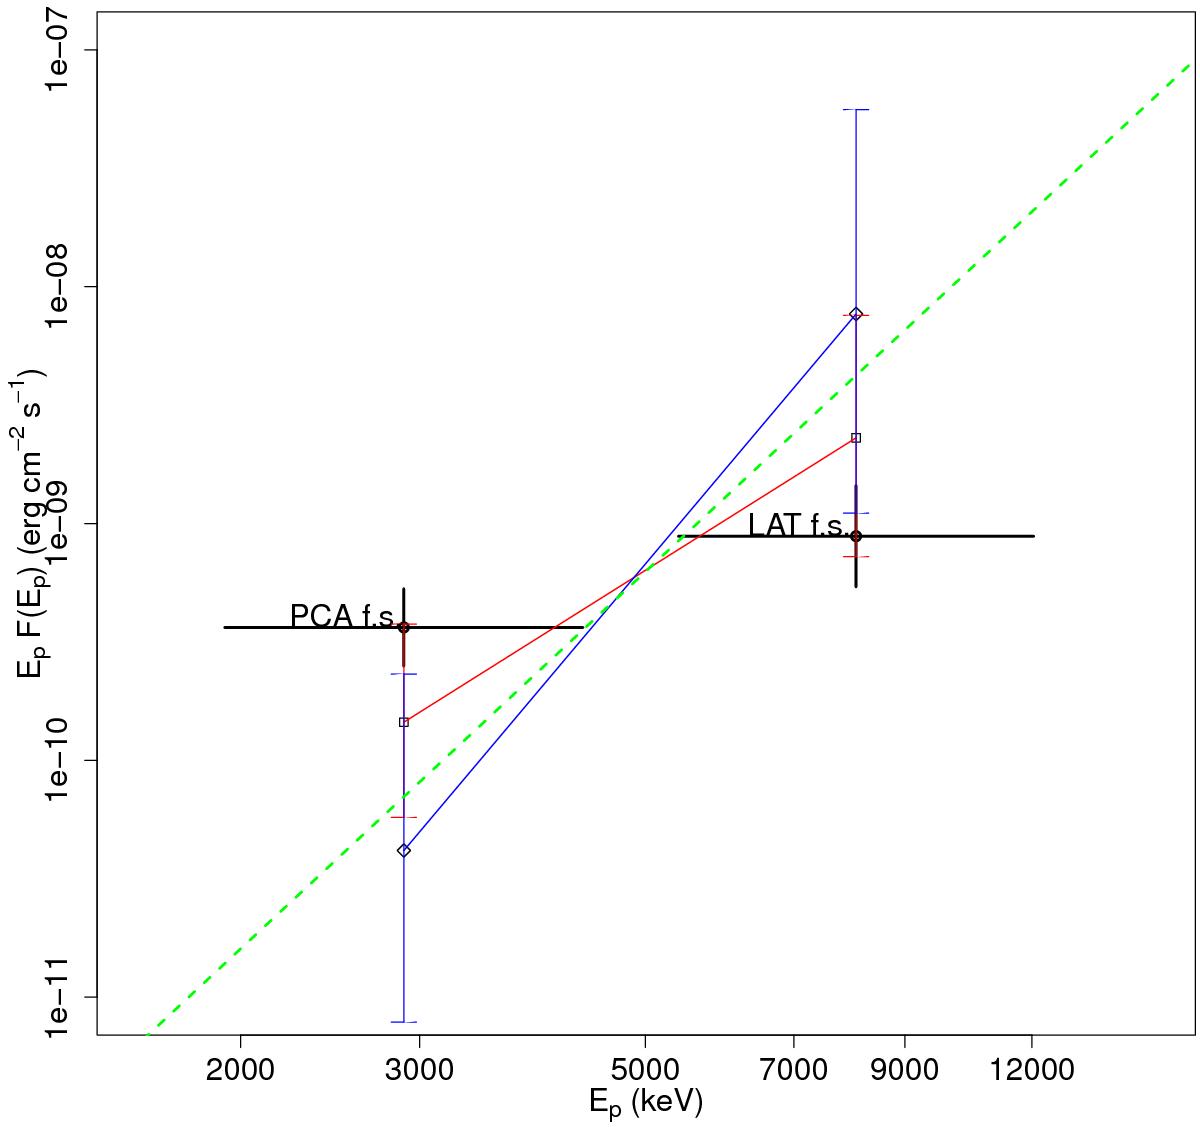
Trend of variation of the SSC flux in the Ep − EpFE(Ep) plane. The black points correspond to the LAT and PCA flaring states. The red line connects the two points with different Lorentz factor γ, the blue line connects the two points with different magnetic field B. The parameters are listed in Table 7. The dotted green line shows the trend associated to δD variation. See text for details.
Current usage metrics show cumulative count of Article Views (full-text article views including HTML views, PDF and ePub downloads, according to the available data) and Abstracts Views on Vision4Press platform.
Data correspond to usage on the plateform after 2015. The current usage metrics is available 48-96 hours after online publication and is updated daily on week days.
Initial download of the metrics may take a while.