Free Access
Fig. 1
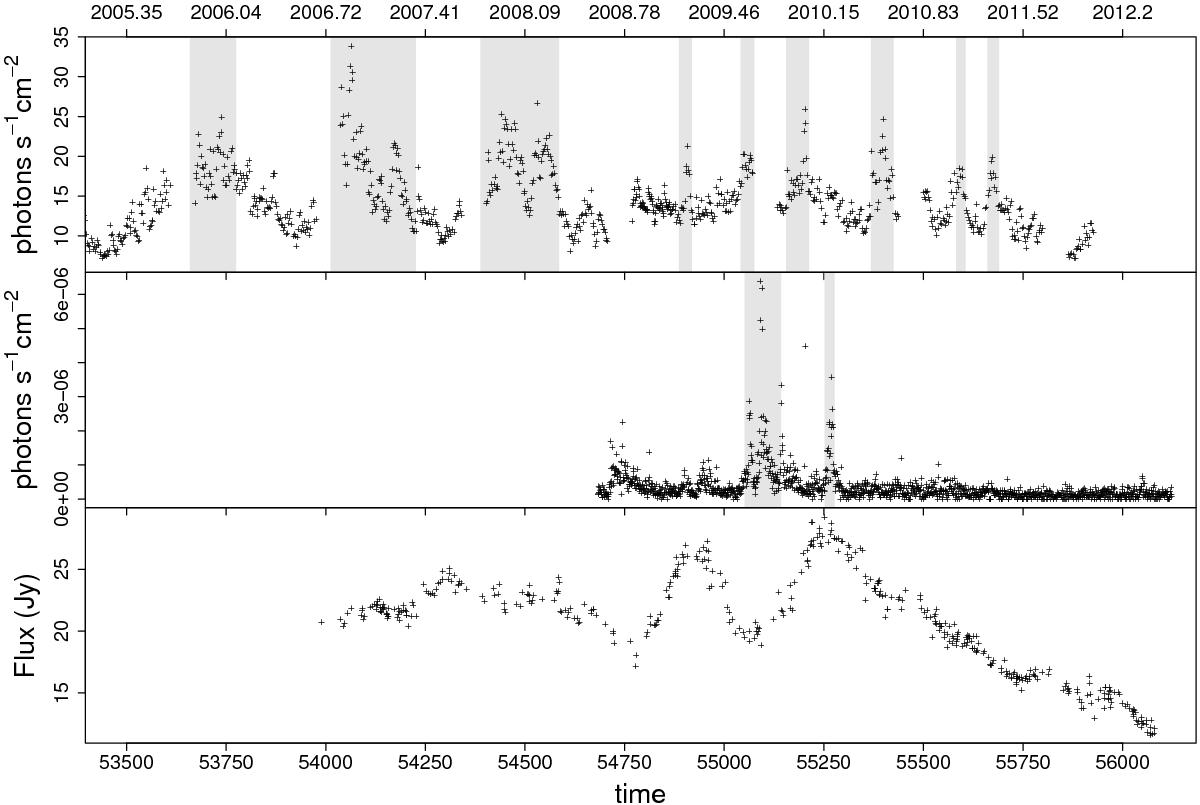
Top panel: RXTE-PCA lightcurve in 0.2−75 keV. Middle panel: Fermi-LAT lightcurve in 0.1−100 GeV. Area marked in light grey colour shows the selected flaring time epochs in both lightcurves. Bottom panel: radio lightcurve at 37 GHz. Time units are days on bottom axis (modified Julian date) and decimal years on top axis.
Current usage metrics show cumulative count of Article Views (full-text article views including HTML views, PDF and ePub downloads, according to the available data) and Abstracts Views on Vision4Press platform.
Data correspond to usage on the plateform after 2015. The current usage metrics is available 48-96 hours after online publication and is updated daily on week days.
Initial download of the metrics may take a while.