Free Access
Fig. 7
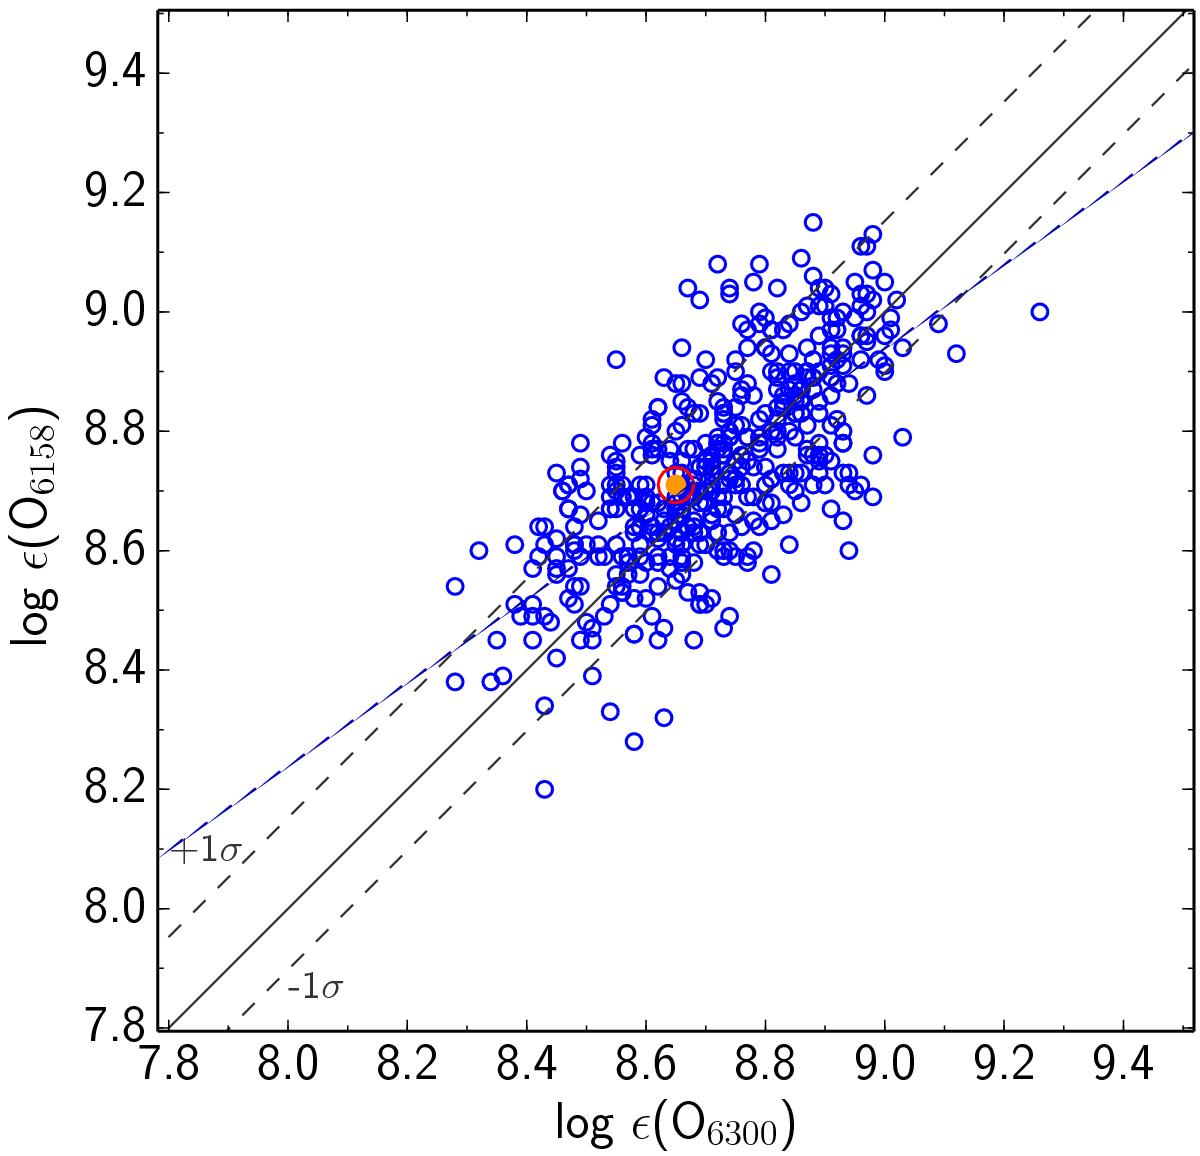
Comparison of the absolute oxygen abundances from OI6158 Å with those obtained from [OI]6300 Å lines. Solid lines represent the diagonal and the linear fit to the data. Dashed lines enclose 68% of the data around the mean (0.024 dex).
Current usage metrics show cumulative count of Article Views (full-text article views including HTML views, PDF and ePub downloads, according to the available data) and Abstracts Views on Vision4Press platform.
Data correspond to usage on the plateform after 2015. The current usage metrics is available 48-96 hours after online publication and is updated daily on week days.
Initial download of the metrics may take a while.