Free Access
Fig. A.1
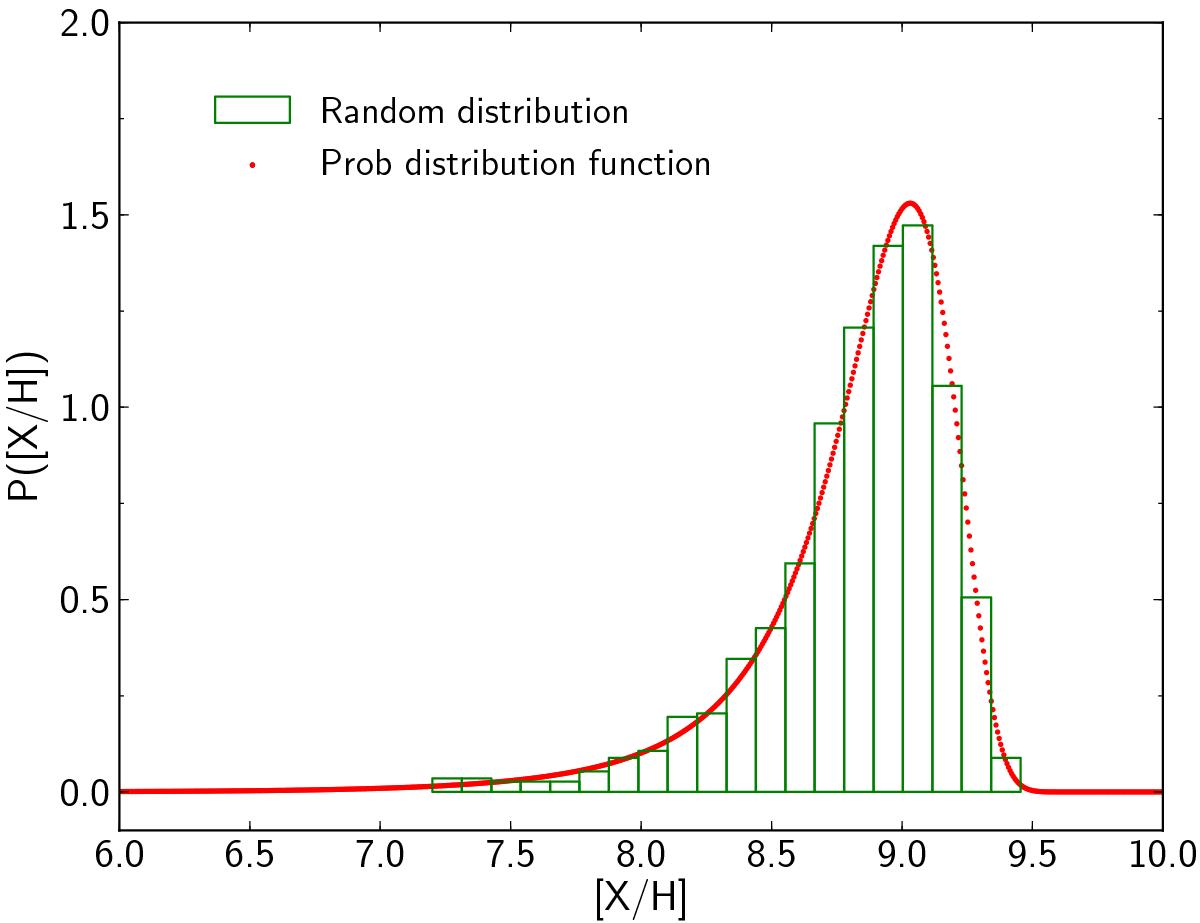
Abundance distribution probability for a large asymmetry case. Red dots represent the analytically derived function. Green bars represent the distribution of the abundance calculated with the curve of growth for a set of random EW values that follow a truncated Gaussian distribution.
Current usage metrics show cumulative count of Article Views (full-text article views including HTML views, PDF and ePub downloads, according to the available data) and Abstracts Views on Vision4Press platform.
Data correspond to usage on the plateform after 2015. The current usage metrics is available 48-96 hours after online publication and is updated daily on week days.
Initial download of the metrics may take a while.