Fig. 16
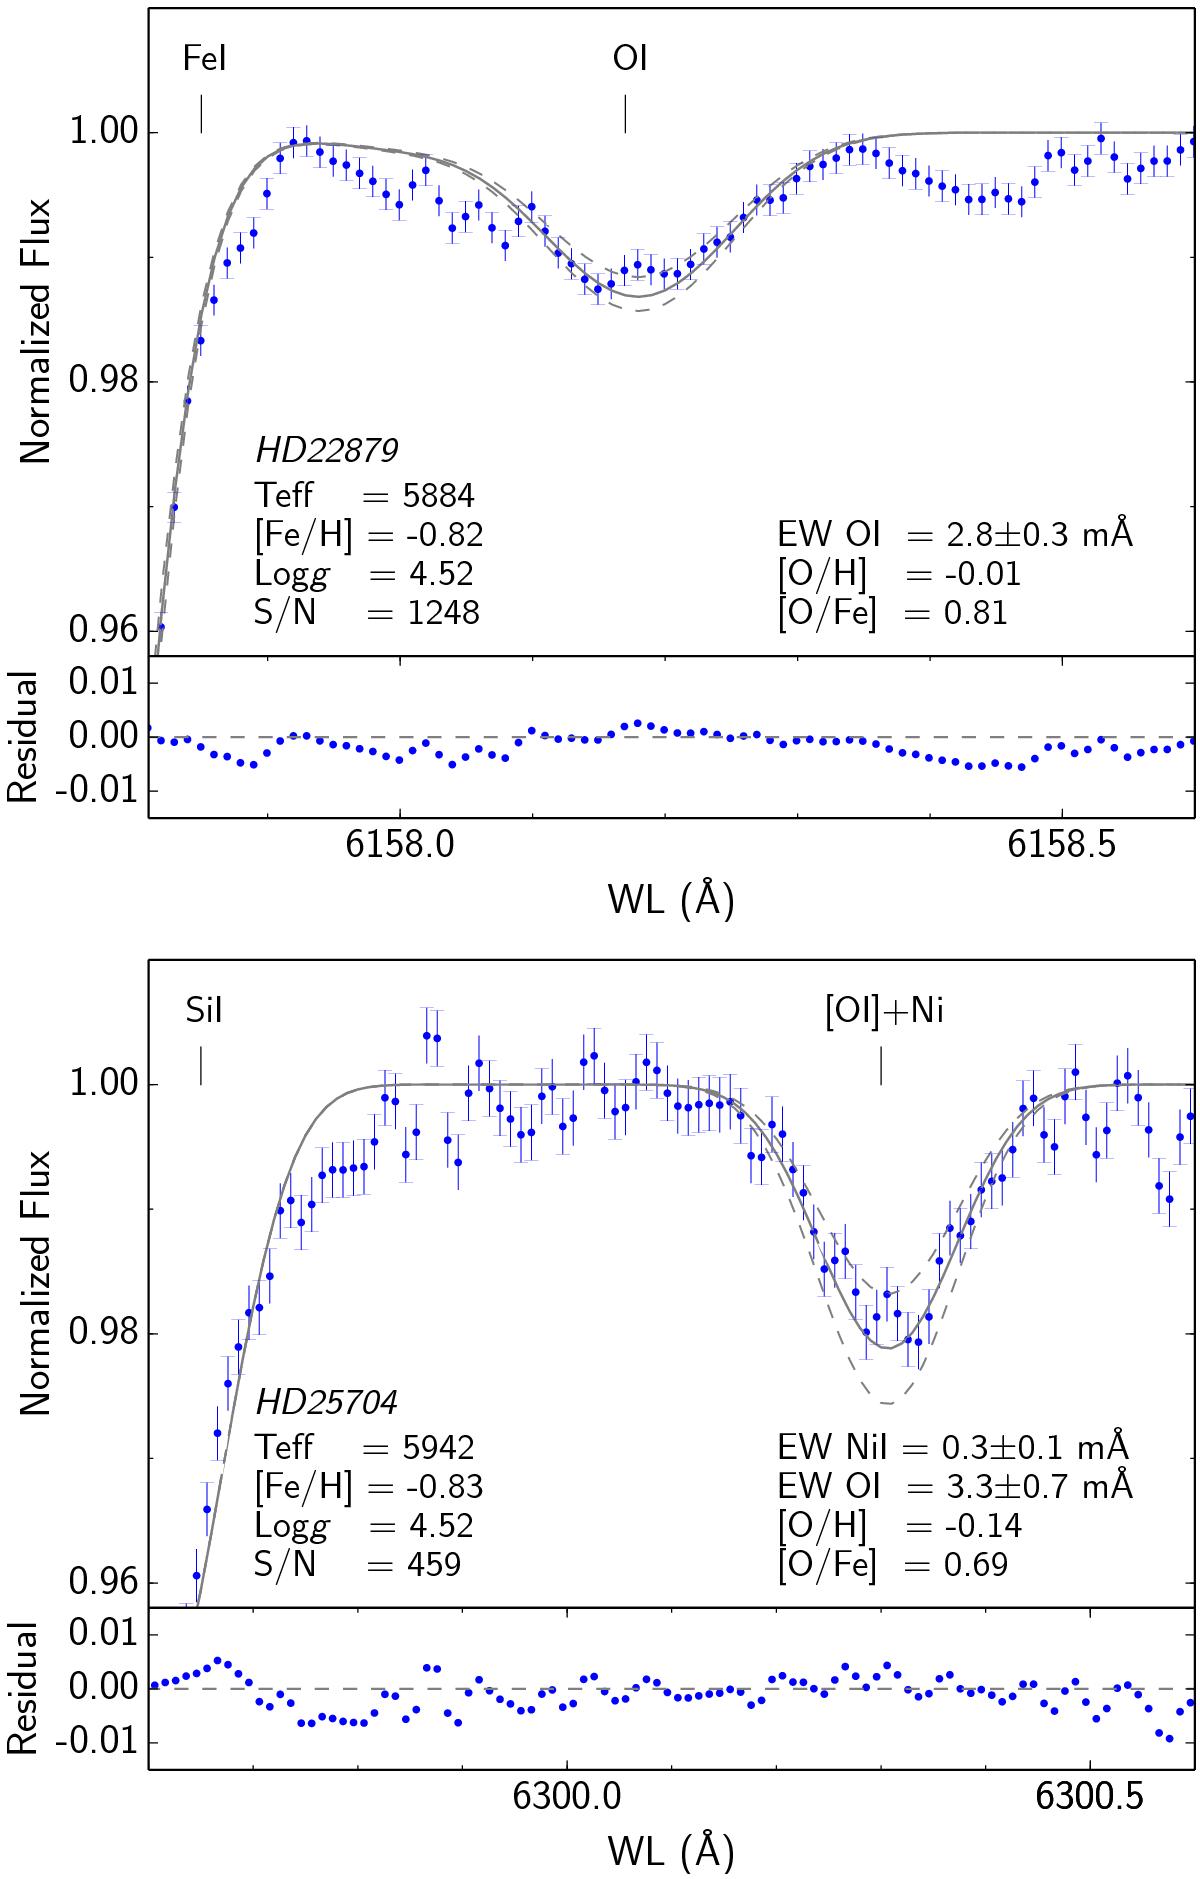
Spectral synthesis of the oxygen line at 6158 Å in HD 22879 (upper panel) and [OI]6300 in HD 25704 (lower panel). The observed spectra (dots) with the 1σ photometric noise (rms) is compared with the synthetic spectra, computed for the corresponding [Fe/H] and [O/H] abundances obtained from our EW measurements (solid line). Dashed lines represent the synthetic spectra for the ± 1σ error abundances, which are δ [Fe/H] = ± 0.03 dex, ![]() dex and
dex and ![]() dex (propagated from the provided EW error). Also shown are the stellar parameters, nominal S/N, abundances, EW and residual intensities (observed - predicted).
dex (propagated from the provided EW error). Also shown are the stellar parameters, nominal S/N, abundances, EW and residual intensities (observed - predicted).
Current usage metrics show cumulative count of Article Views (full-text article views including HTML views, PDF and ePub downloads, according to the available data) and Abstracts Views on Vision4Press platform.
Data correspond to usage on the plateform after 2015. The current usage metrics is available 48-96 hours after online publication and is updated daily on week days.
Initial download of the metrics may take a while.