Fig. 14
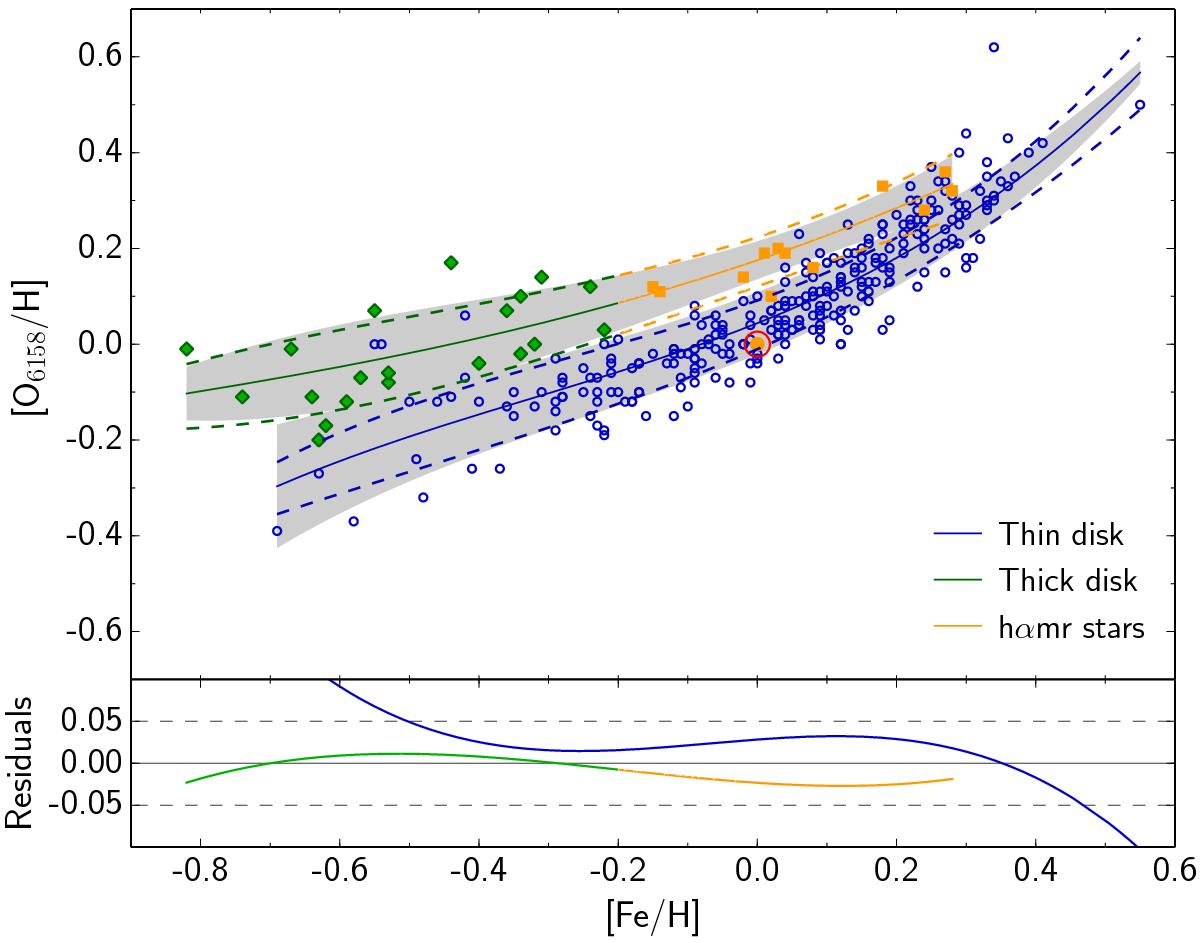
Upper panel: [O/H] vs. [Fe/H] for OI 6158 Å. Only stars with EW relative error below 25% are considered. Stars are sepparated in different disk populations according to a chemical criteria. Solid line represent the average oxygen abundance. The 1σ level of dispersion around the mean is presented as a shaded area. Dashed line shows the average uncertainties. For plotting purposes the average uncertainties are shown around the mean abundance. Lower panel: difference between the ± 1σ width of the scatter around the mean and the ± 1σ width of the uncertainties.
Current usage metrics show cumulative count of Article Views (full-text article views including HTML views, PDF and ePub downloads, according to the available data) and Abstracts Views on Vision4Press platform.
Data correspond to usage on the plateform after 2015. The current usage metrics is available 48-96 hours after online publication and is updated daily on week days.
Initial download of the metrics may take a while.