Free Access
Fig. 13
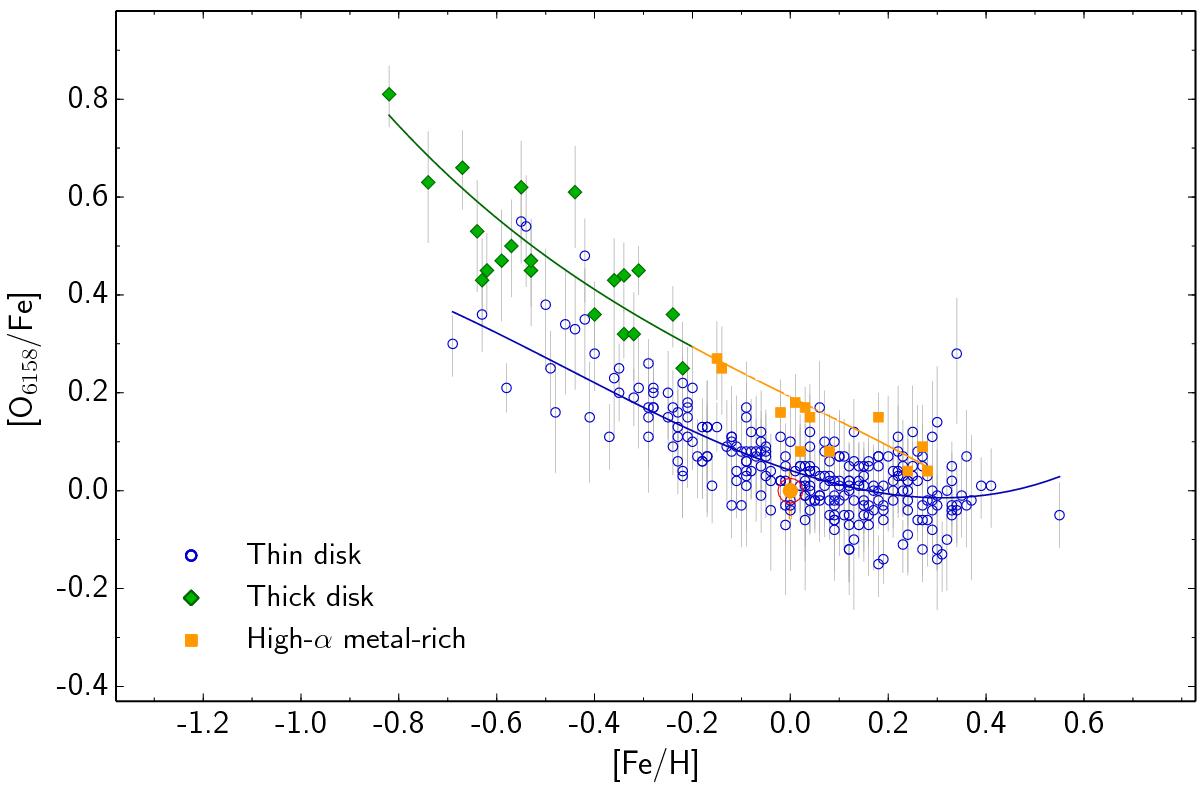
[O/Fe] vs. [Fe/H] for the stars with δEW< 25%. Stars from different populations are separated according to their chemical composition. Solid lines represent the fitted trend, weighted with the uncertainties, for each population (thick and hαmr stars are fitted as a single population). Absolute error bars are over-plotted.
Current usage metrics show cumulative count of Article Views (full-text article views including HTML views, PDF and ePub downloads, according to the available data) and Abstracts Views on Vision4Press platform.
Data correspond to usage on the plateform after 2015. The current usage metrics is available 48-96 hours after online publication and is updated daily on week days.
Initial download of the metrics may take a while.