Fig. 8
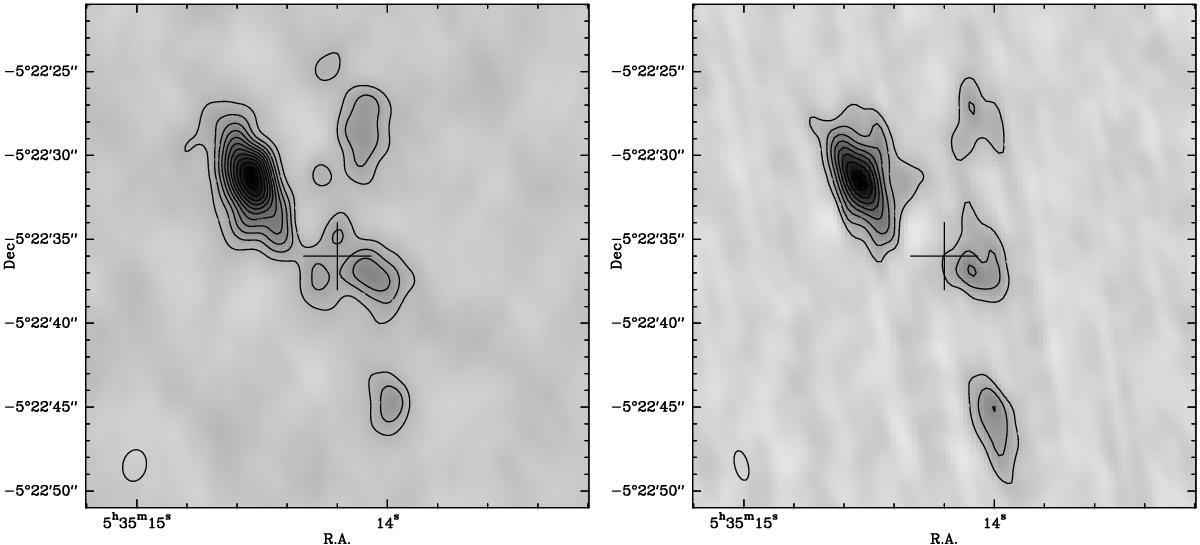
Left: continuum map obtained with ALMA at 223 GHz. The beam shown in the bottom left corner is 1.92″× 1.38″. Right: continuum map obtained with the IRAM Plateau de Bure Interferometer at 223 GHz (Favre et al. 2011). The beam shown in the bottom left corner is 1.79″× 0.79″. The level step and first contour for the two maps are 1 K.
Current usage metrics show cumulative count of Article Views (full-text article views including HTML views, PDF and ePub downloads, according to the available data) and Abstracts Views on Vision4Press platform.
Data correspond to usage on the plateform after 2015. The current usage metrics is available 48-96 hours after online publication and is updated daily on week days.
Initial download of the metrics may take a while.