Free Access
Fig. 7
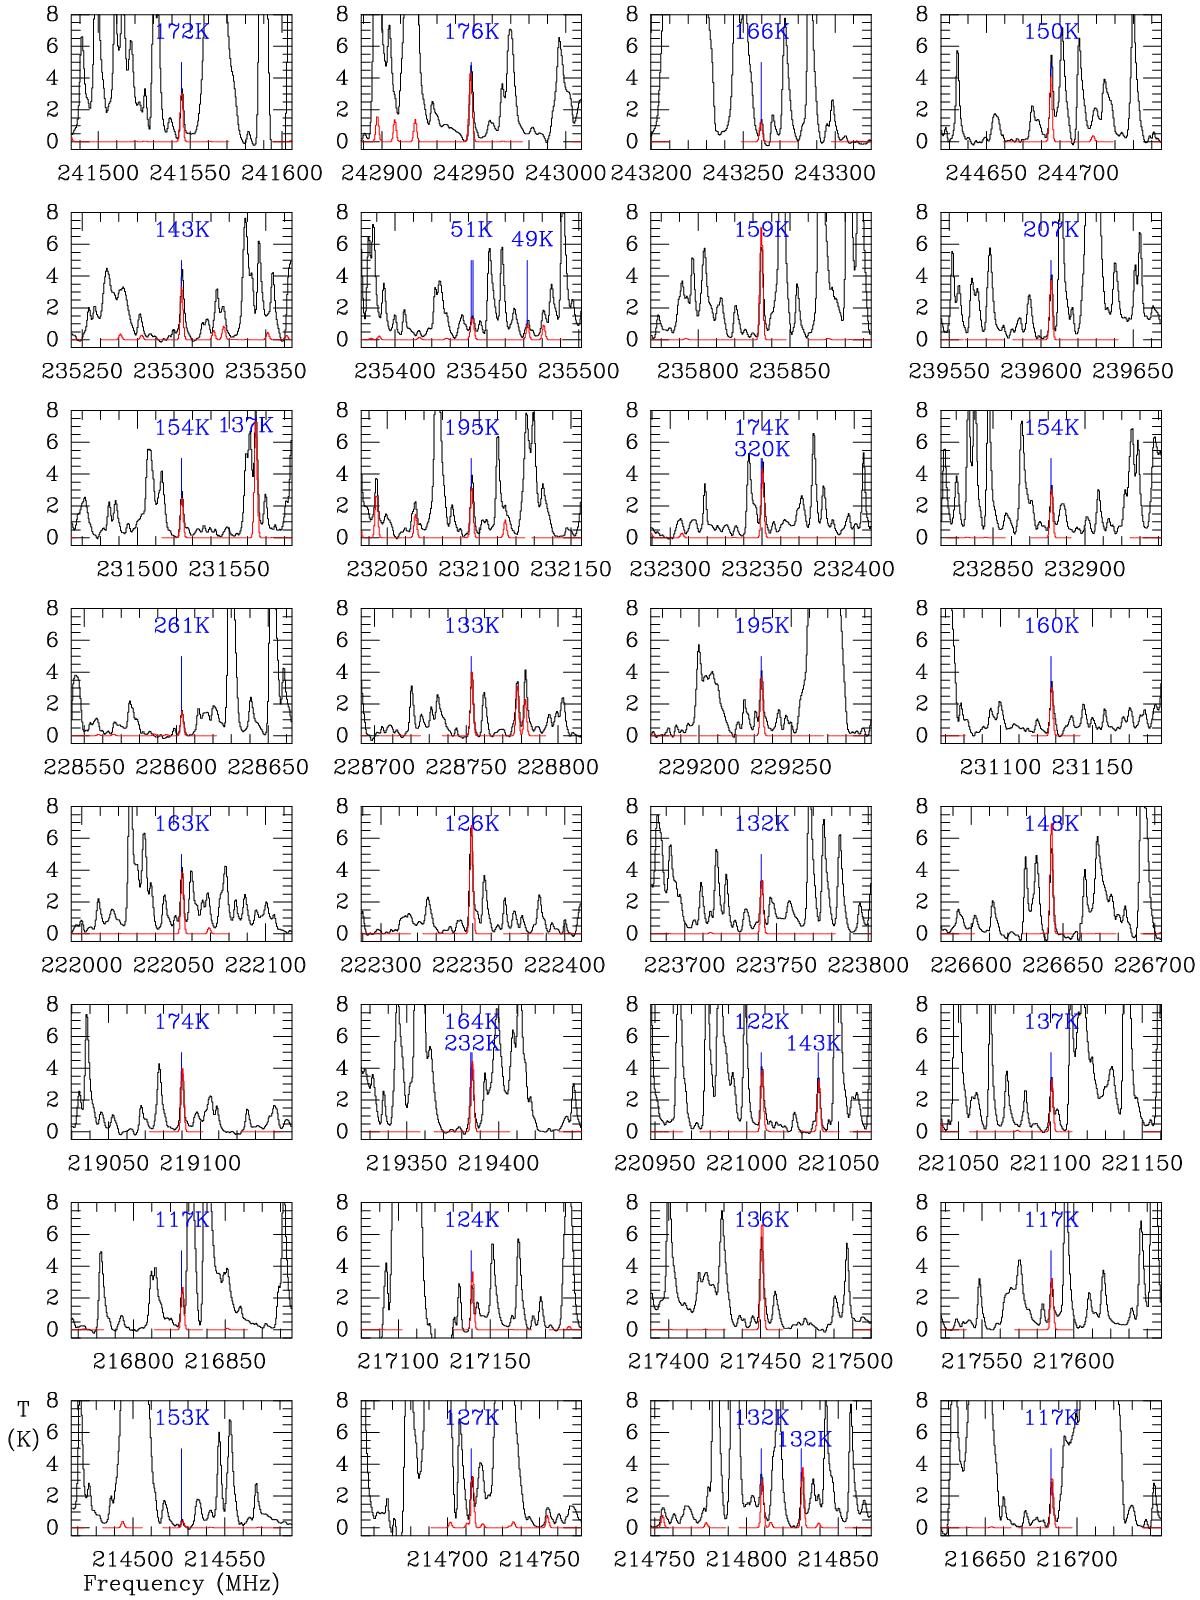
ALMA spectrum (in black) towards the ethylene glycol peak at the ethylene glycol frequencies listed in Table 1. The synthetic spectrum of ethylene glycol (EG) is overlaid in red and the value of the upper state energy (Eu) is indicated in blue.
Current usage metrics show cumulative count of Article Views (full-text article views including HTML views, PDF and ePub downloads, according to the available data) and Abstracts Views on Vision4Press platform.
Data correspond to usage on the plateform after 2015. The current usage metrics is available 48-96 hours after online publication and is updated daily on week days.
Initial download of the metrics may take a while.