Fig. 3
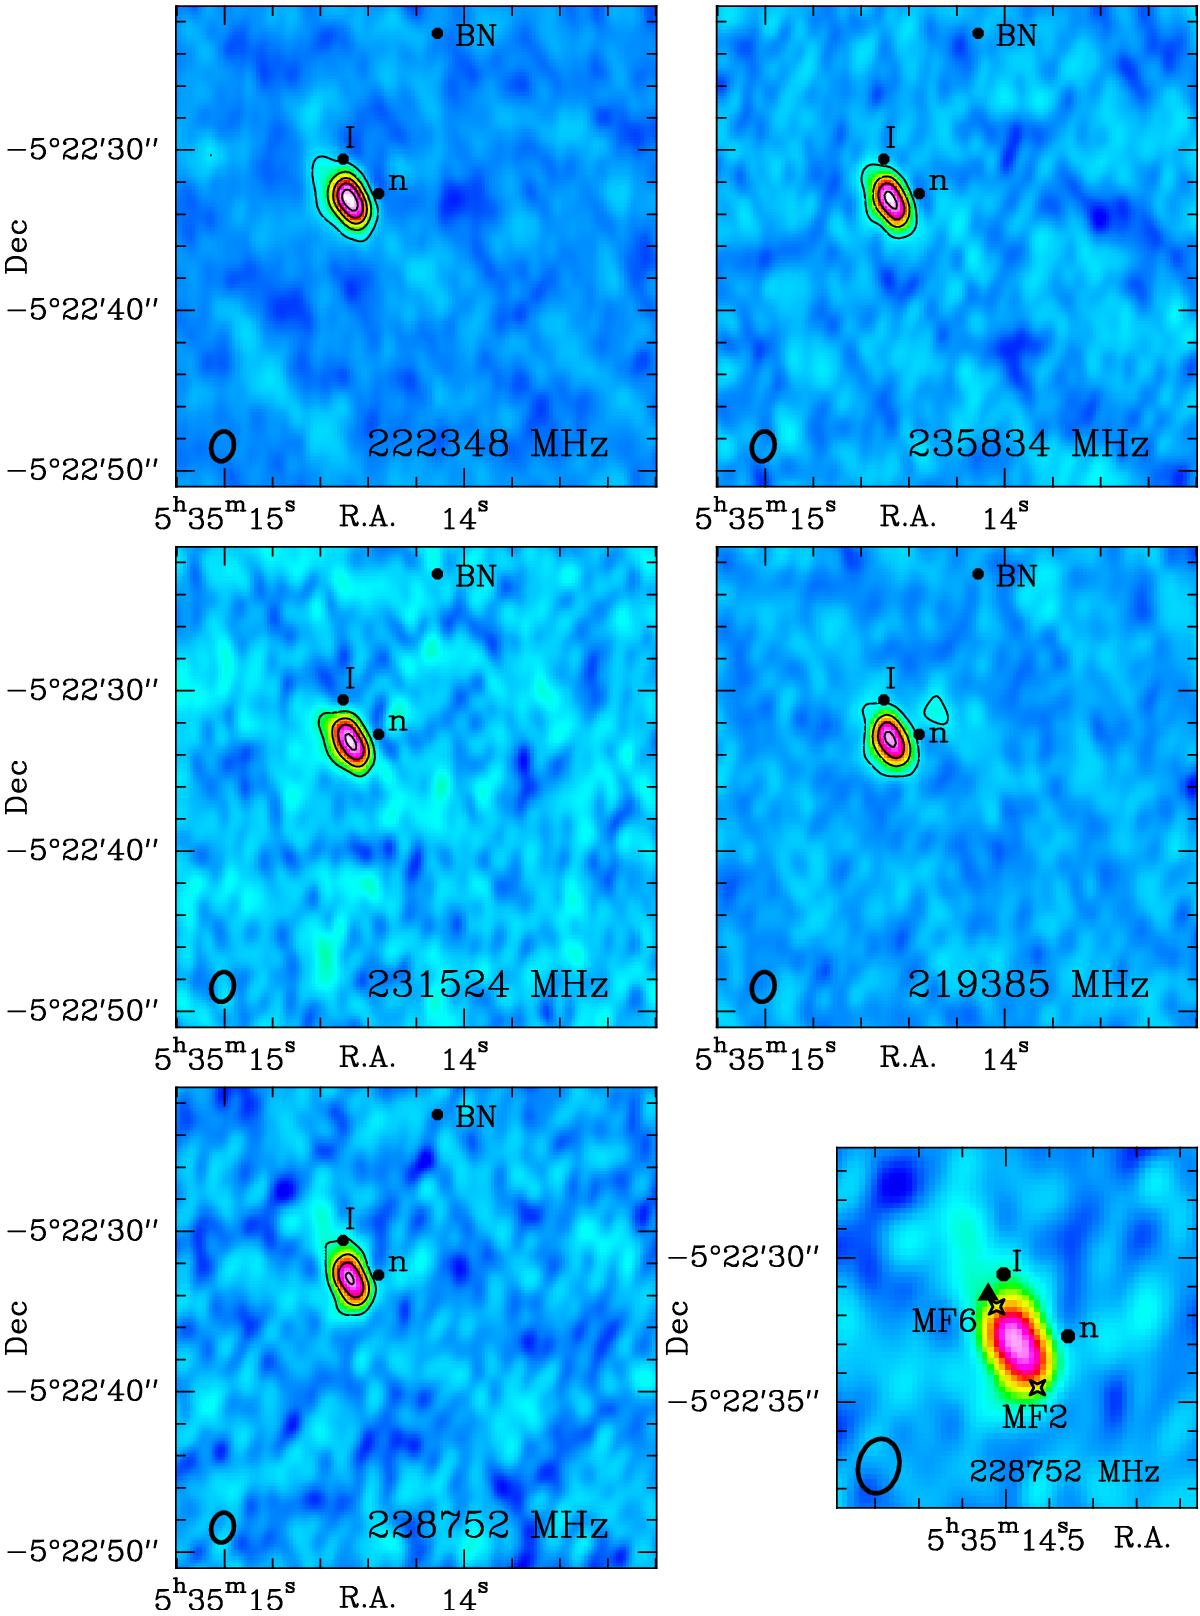
ALMA ethylene glycol integrated intensity maps of the five less blended lines. The frequency of the transition is indicated at the bottom of the map and the first contour level corresponds to 4σ. The beam shown in the bottom left corner is 1.9″× 1.39″. The BN object position is (αJ2000 = 05h35m14![]() 11, δJ2000 = −05°22′22
11, δJ2000 = −05°22′22![]() 72), the radio source I position is (αJ2000 = 05h35m14
72), the radio source I position is (αJ2000 = 05h35m14![]() 51, δJ2000 = −05°22′30
51, δJ2000 = −05°22′30![]() 57), and the IR source n position is (αJ2000 = 05h35m14
57), and the IR source n position is (αJ2000 = 05h35m14![]() 36, δJ2000 = −05°22′32
36, δJ2000 = −05°22′32![]() 72) (Goddi et al. 2011b). The map to the lower right is a blow up of the 228 752 MHz map. The triangle marks the position of the continuum emission peak (see map in Fig. 8) and the stars mark the MF2 and MF6 methyl formate positions of Favre et al. (2011). The ethylene glycol emission peaks at (αJ2000 = 05h35m14
72) (Goddi et al. 2011b). The map to the lower right is a blow up of the 228 752 MHz map. The triangle marks the position of the continuum emission peak (see map in Fig. 8) and the stars mark the MF2 and MF6 methyl formate positions of Favre et al. (2011). The ethylene glycol emission peaks at (αJ2000 = 05h35m14![]() 47, δJ2000 = −05°22′33
47, δJ2000 = −05°22′33![]() 17). The lines are integrated over the velocity range 5–10 km s-1 for the 222 348 MHz transition, 5.5–10 km s-1 for 235 834 MHz, 7–10 km s-1 for 231 524 MHz, 6–9.5 km s-1 for 219 385 MHz and 4–11 km s-1 for 228 752 MHz. The level step and first contour are 6 and 2.8 K km s-1 for the 222 348 MHz transition, 7.6 and 3.6 K km s-1 for 235 834 MHz, 2.5 and 1.7 K km s-1 for 231 524 MHz, 5 and 1.9 K km s-1 for 219 385 MHz and 4.4 and 2.9 K km s-1 for 228 752 MHz.
17). The lines are integrated over the velocity range 5–10 km s-1 for the 222 348 MHz transition, 5.5–10 km s-1 for 235 834 MHz, 7–10 km s-1 for 231 524 MHz, 6–9.5 km s-1 for 219 385 MHz and 4–11 km s-1 for 228 752 MHz. The level step and first contour are 6 and 2.8 K km s-1 for the 222 348 MHz transition, 7.6 and 3.6 K km s-1 for 235 834 MHz, 2.5 and 1.7 K km s-1 for 231 524 MHz, 5 and 1.9 K km s-1 for 219 385 MHz and 4.4 and 2.9 K km s-1 for 228 752 MHz.
Current usage metrics show cumulative count of Article Views (full-text article views including HTML views, PDF and ePub downloads, according to the available data) and Abstracts Views on Vision4Press platform.
Data correspond to usage on the plateform after 2015. The current usage metrics is available 48-96 hours after online publication and is updated daily on week days.
Initial download of the metrics may take a while.