Fig. 2
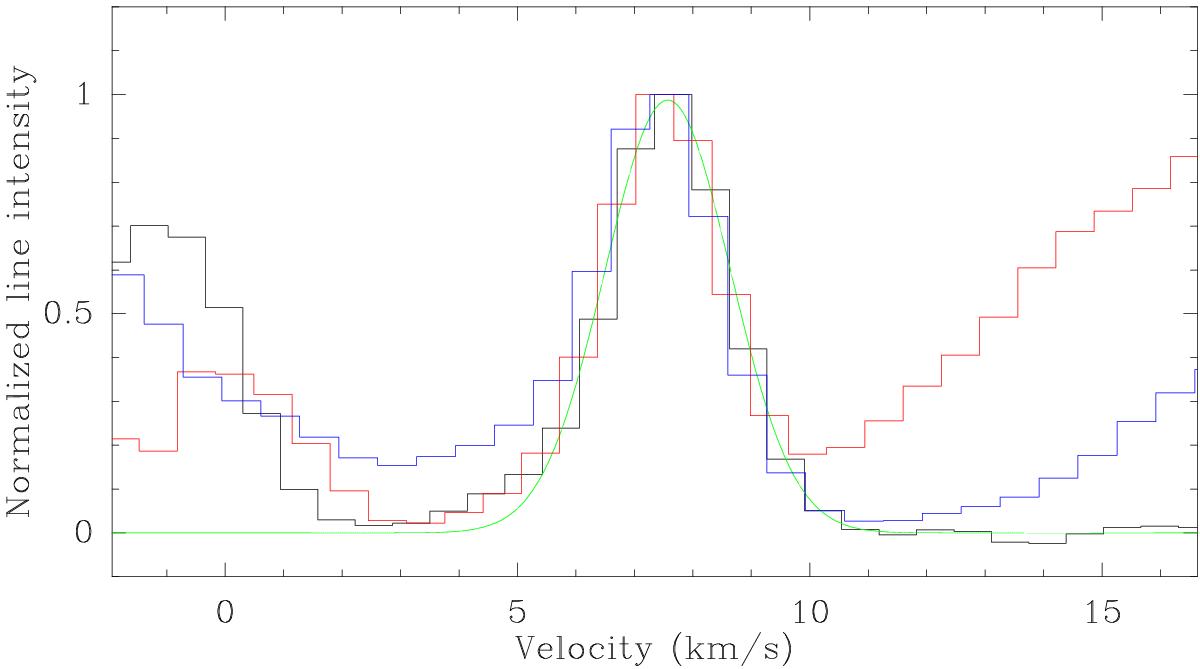
Superposition of the 228 752 MHz transition spectrum at the ethylene glycol peak (in black) with the average spectrum of 11 transitions that have no blends near 5 km s-1 (in red) and the average spectrum of 14 transitions that have no blends near 10 km s-1 (in blue). All spectra are normalized to 1. A Gaussian fit to the 228 752 MHz line is shown in green. A faint wing is visible at lower velocities.
Current usage metrics show cumulative count of Article Views (full-text article views including HTML views, PDF and ePub downloads, according to the available data) and Abstracts Views on Vision4Press platform.
Data correspond to usage on the plateform after 2015. The current usage metrics is available 48-96 hours after online publication and is updated daily on week days.
Initial download of the metrics may take a while.