Fig. 1
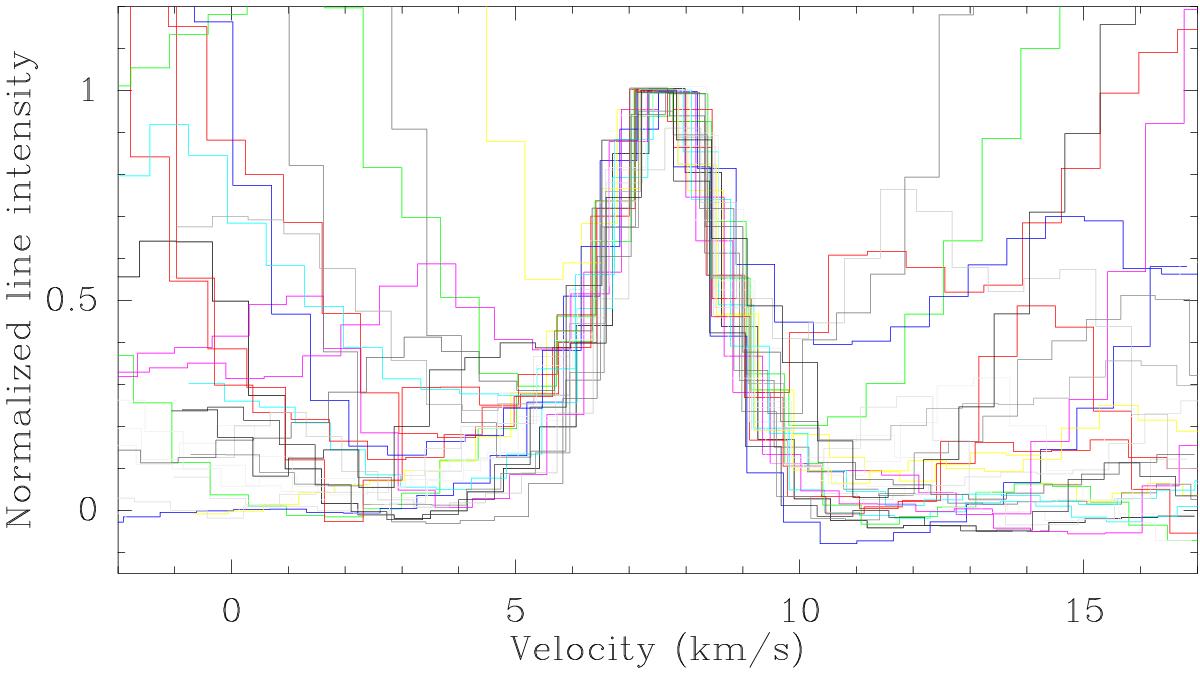
Superposition of the unblended and partially blended ethylene glycol lines listed in Table 1. The lines corresponding to close pairs of transitions separated by 0.5–1 MHz are not included in this plot as their profile is broadened. The spectra are towards the ethylene glycol peak (αJ2000 = 05h35m14![]() 47, δJ2000 = −05°22′33
47, δJ2000 = −05°22′33![]() 17) and are normalized to 1.
17) and are normalized to 1.
Current usage metrics show cumulative count of Article Views (full-text article views including HTML views, PDF and ePub downloads, according to the available data) and Abstracts Views on Vision4Press platform.
Data correspond to usage on the plateform after 2015. The current usage metrics is available 48-96 hours after online publication and is updated daily on week days.
Initial download of the metrics may take a while.