Fig. 8
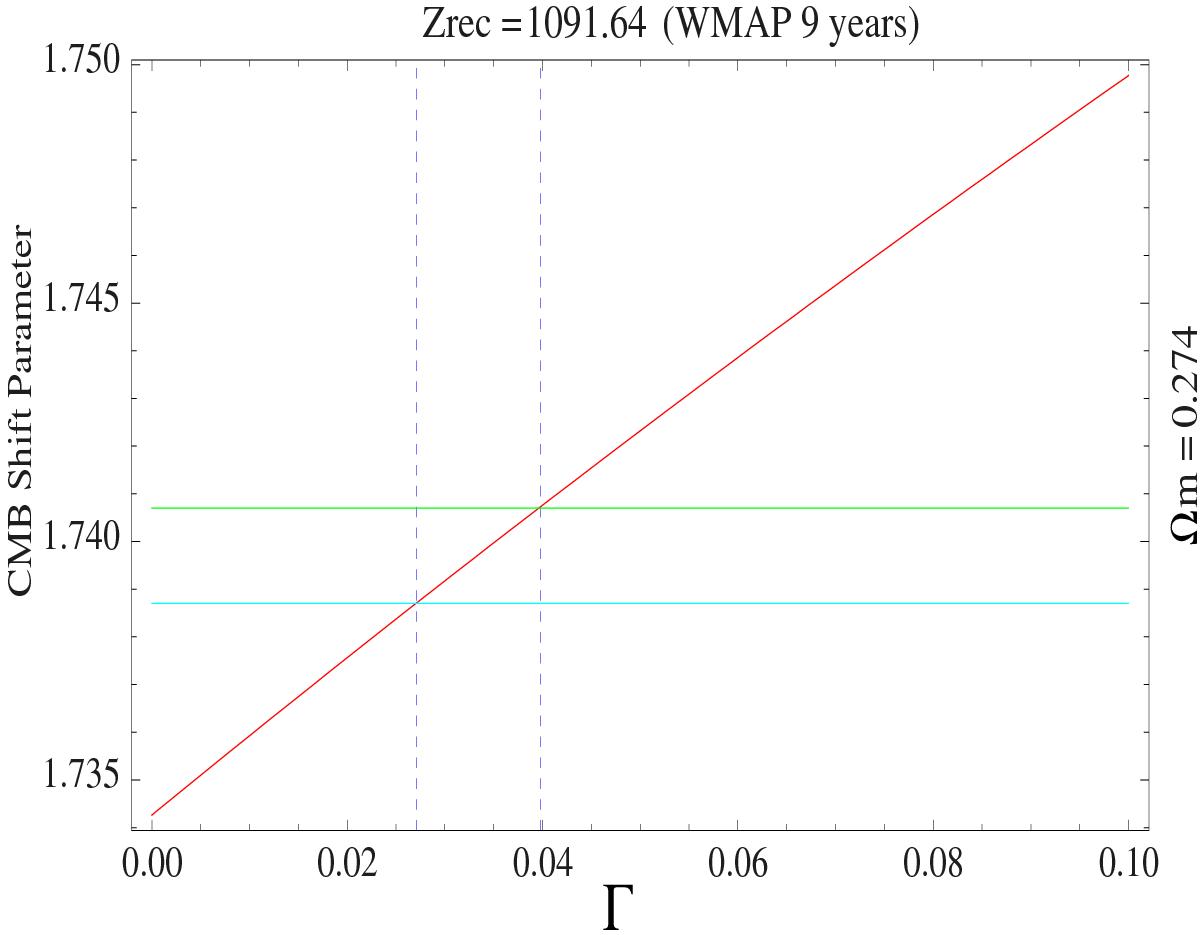
Theoretically (in the context of a polytropic-DM model) determined CMB-shift parameter, Eq. (111), as a function of the polytropic exponent −0.089 < Γ ≤ 0 (red solid line). The cyan horizontal straight line denotes the upper bound (at 68% CL) of the R-value, obtained from the nine-year WMAP survey final results, namely, R = 1.7387, and the corresponding green line denotes the mean value of R, arising from the combination of the Planck first-data release with those of the WMAP survey, namely, R = 1.7407. The vertical dashed lines denote the upper bound of Γ(| Γ | = 0.0271), arising from WMAP alone, and the corresponding most preferable value (| Γ | = 0.0398), arising from the combination of the Planck first-data release with those of the WMAP survey.
Current usage metrics show cumulative count of Article Views (full-text article views including HTML views, PDF and ePub downloads, according to the available data) and Abstracts Views on Vision4Press platform.
Data correspond to usage on the plateform after 2015. The current usage metrics is available 48-96 hours after online publication and is updated daily on week days.
Initial download of the metrics may take a while.