Fig. 2
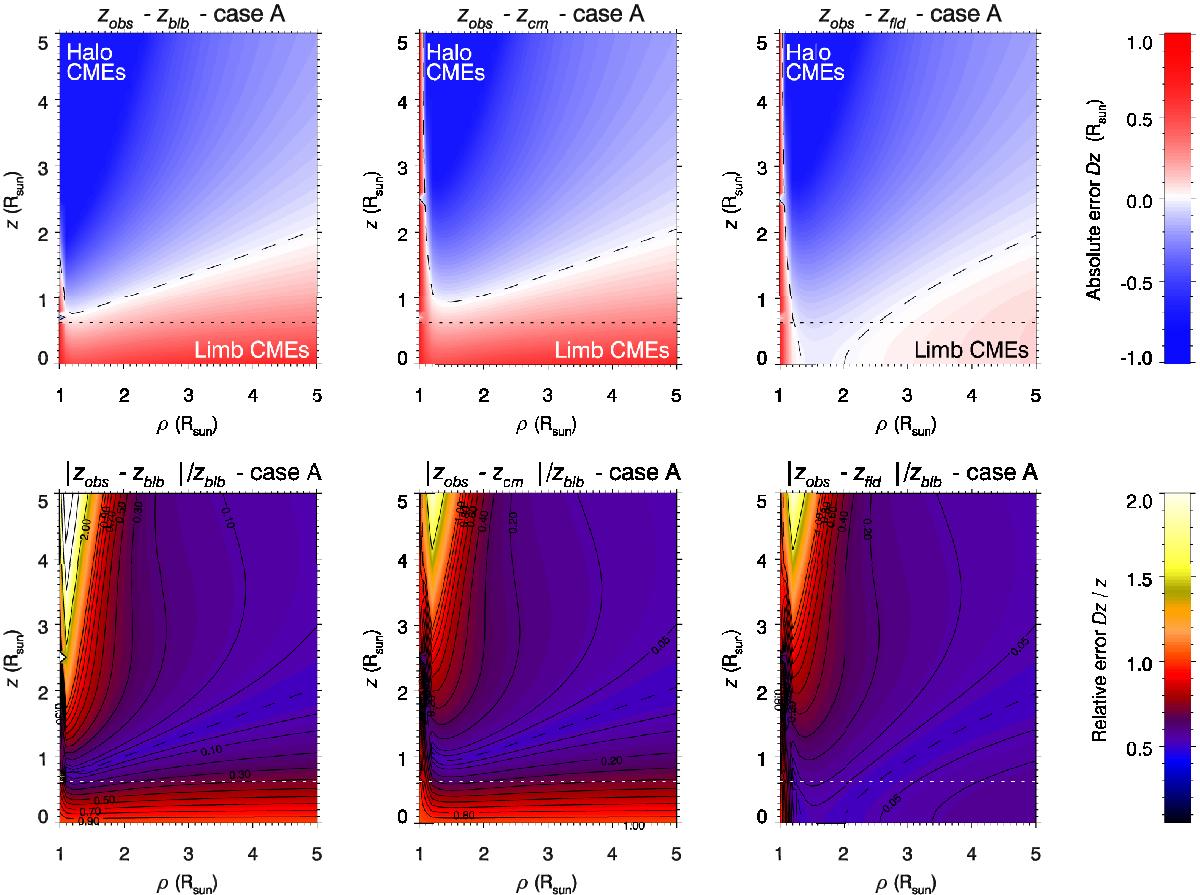
Top row: errors in the determination of a CME position along the line of sight as a function of the projected position on the POS (ρ, x-axis) and the distance from that plane (z, y-axis) under the hypothesis of a constant density distribution across the CME (case A). The plots show regions where the distance is under (over) -estimated in blue (red) with respect to the real location of the CME (left), the center of mass (middle), and the folded density center of mass (right, see text). Bottom row: same as in the top row showing the relative errors. In all the plots the dashed black line shows the points where the location of the blob is determined without errors, while horizontal white dotted line marks the region where the blob distance from the POS starts to be smaller than 1 / 4 of the half width of the blob (![]() ).
).
Current usage metrics show cumulative count of Article Views (full-text article views including HTML views, PDF and ePub downloads, according to the available data) and Abstracts Views on Vision4Press platform.
Data correspond to usage on the plateform after 2015. The current usage metrics is available 48-96 hours after online publication and is updated daily on week days.
Initial download of the metrics may take a while.