Fig. 1
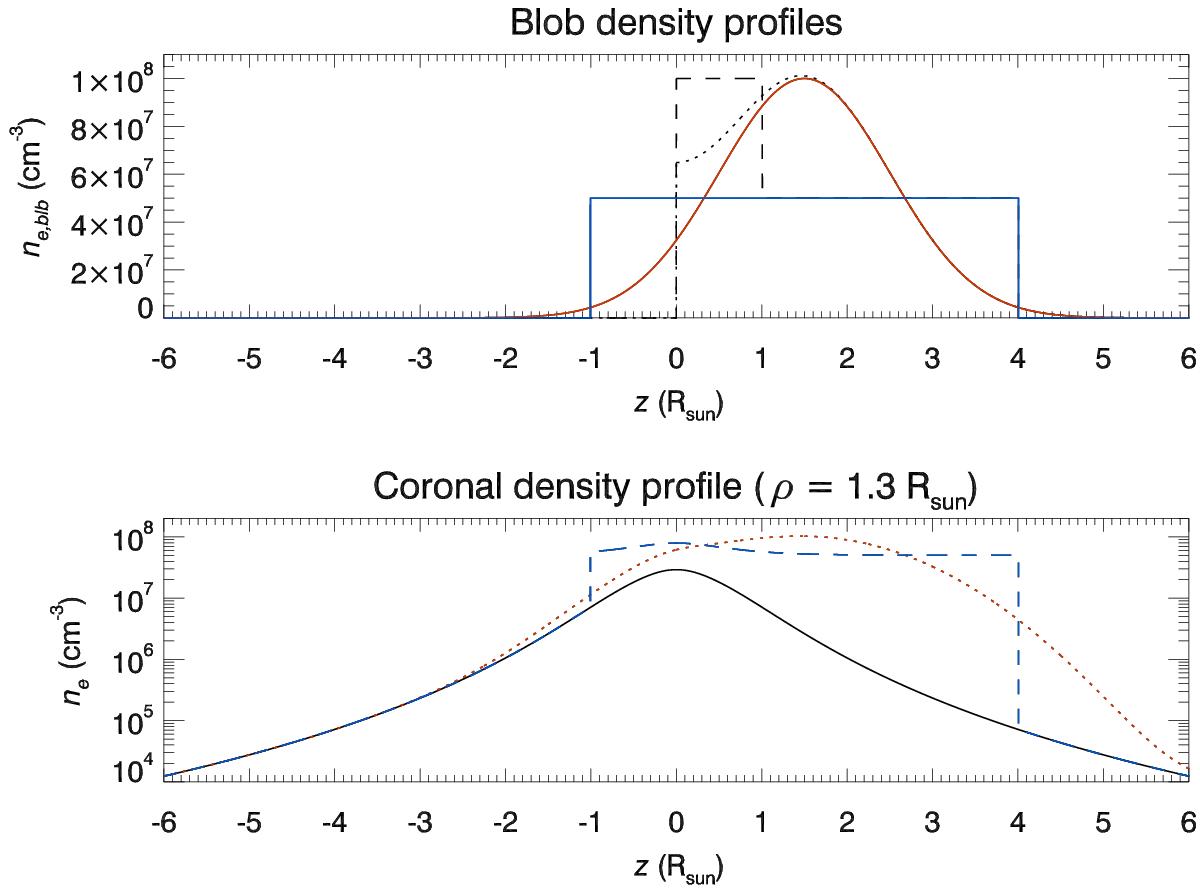
Top: blob density distribution ne,blb along the LOS coordinate z for the case (A) of constant density (solid blue line) and the case (B) of gaussian density distribution (solid red line). For future reference this figure also shows the folded density distributions (see text) corresponding to the constant density blob (dashed line) and to the gaussian density blob (dotted line). Bottom: coronal density distribution ne,cor along the LOS (solid line) and total density distributions for the cases A (dashed blue line) and B (dotted red line).
Current usage metrics show cumulative count of Article Views (full-text article views including HTML views, PDF and ePub downloads, according to the available data) and Abstracts Views on Vision4Press platform.
Data correspond to usage on the plateform after 2015. The current usage metrics is available 48-96 hours after online publication and is updated daily on week days.
Initial download of the metrics may take a while.