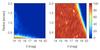
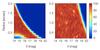
Fig. 22

Galaxy detection probability (in %) for the functional-baseline rejection parameters (top panels) and the optimised parameters (bottom panels). Left-hand-side panels: exponential disk profiles while the right-hand-side panels represent de Vaucouleurs profiles. Noise structure shared between the upper and lower panels is due to the GIBIS simulation, for instance gaps between CCD rows.
Current usage metrics show cumulative count of Article Views (full-text article views including HTML views, PDF and ePub downloads, according to the available data) and Abstracts Views on Vision4Press platform.
Data correspond to usage on the plateform after 2015. The current usage metrics is available 48-96 hours after online publication and is updated daily on week days.
Initial download of the metrics may take a while.