Fig. 15
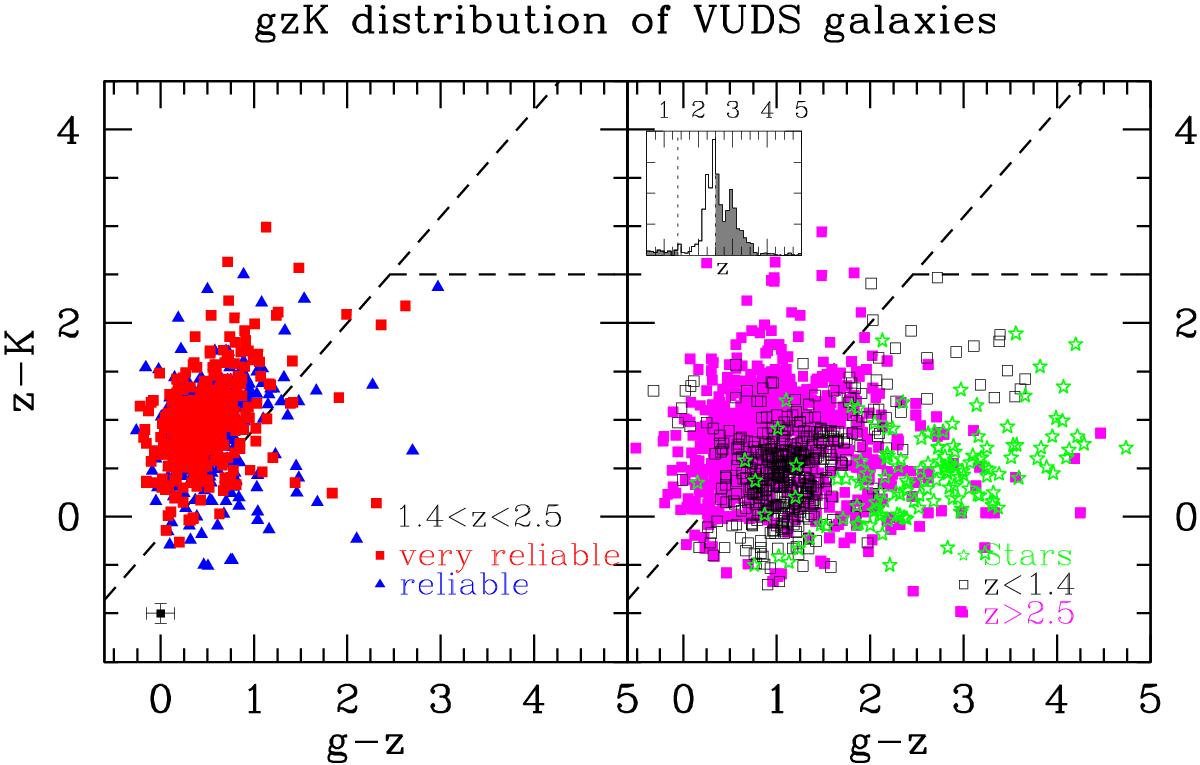
Left panel: (g − z) vs. (z − K) colour–colour diagram for VUDS galaxies with 1.4 < z < 2.5 (flags 3 and 4: red squares, flag 2: blue triangles). The average colour errors are indicated in the lower left corner. Galaxies in this plot are detected in all three bands at more than 3σ (95% of the sample). The gzK selection would have selected 91% of the VUDS galaxies with 1.4 < z < 2.5. Right panel: same for galaxies either with z < 1.4 (open squares) or z > 2.5 (magenta filled squares). Stars are represented by green star symbols. There is a high level of contamination as 58% of galaxies in the selection area of the gzK are outside the redshift range 1.4 < z < 2.5, coming mostly from galaxies at z > 2.5. (inset) redshift distribution of galaxies in the gzK selection area, the grey shaded histogram represents galaxies outside the redshift range 1.4 < z < 2.5.
Current usage metrics show cumulative count of Article Views (full-text article views including HTML views, PDF and ePub downloads, according to the available data) and Abstracts Views on Vision4Press platform.
Data correspond to usage on the plateform after 2015. The current usage metrics is available 48-96 hours after online publication and is updated daily on week days.
Initial download of the metrics may take a while.