Fig. 10
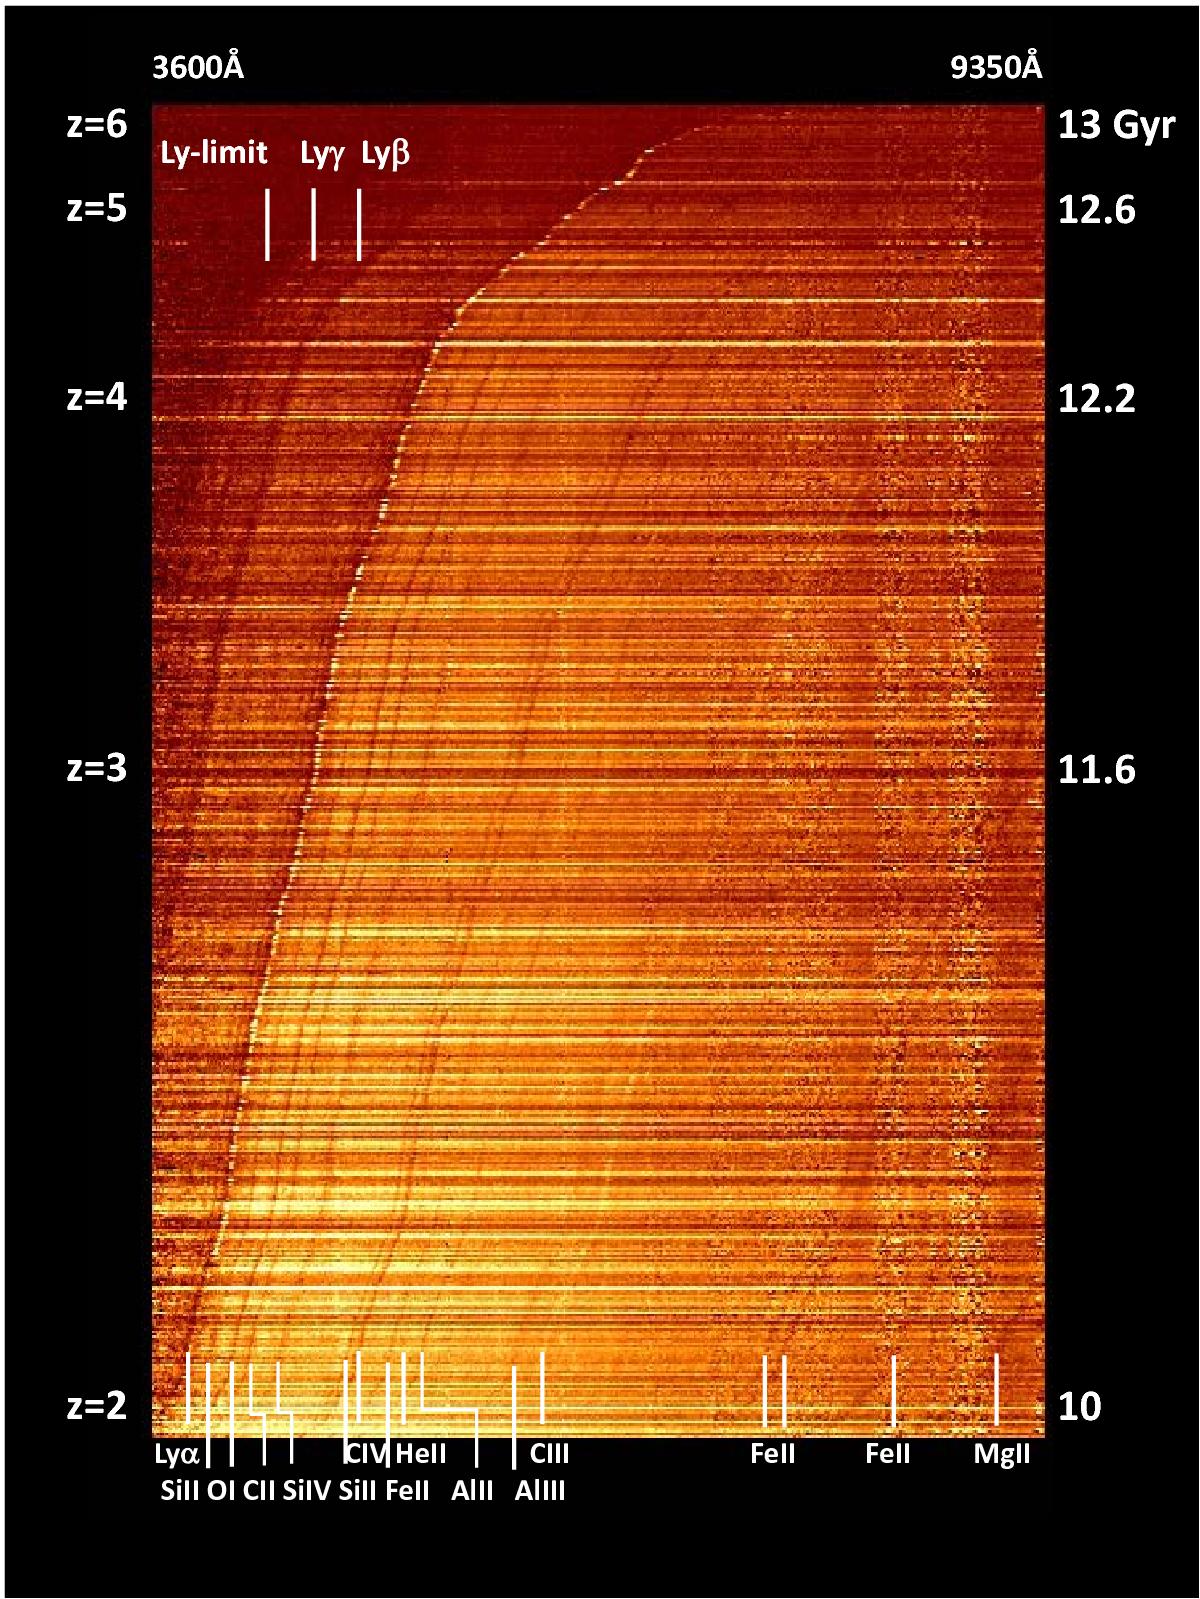
Overview of the spectra obtained in the VUDS survey, with the wavelength extending from 3650 to 9350 Å on the X-axis. The redshift increases (in a non-linear way), as indicated along the left Y-axis, with the corresponding look-back time indicated along the right Y-axis. The image is build with the spectra of all 2 < z < 4 VUDS galaxies with flags 3 and 4, and all spectra with flags 2, 3 and 4 for z > 4, ordered one per image line by increasing redshift. All the main emission and absorption lines can be readily identified in this image, even faint ones, thanks to the increased contrast produced by the continuous display of spectra. The main spectral lines are identified at the top left (below Lyα) and at the bottom of the plot (above Lyα), as listed in Table 4. The vertical bands appearing at fixed wavelength in the red correspond to increased residual noise after subtracting the strong atmospheric OH-bands.
Current usage metrics show cumulative count of Article Views (full-text article views including HTML views, PDF and ePub downloads, according to the available data) and Abstracts Views on Vision4Press platform.
Data correspond to usage on the plateform after 2015. The current usage metrics is available 48-96 hours after online publication and is updated daily on week days.
Initial download of the metrics may take a while.