Fig. 4
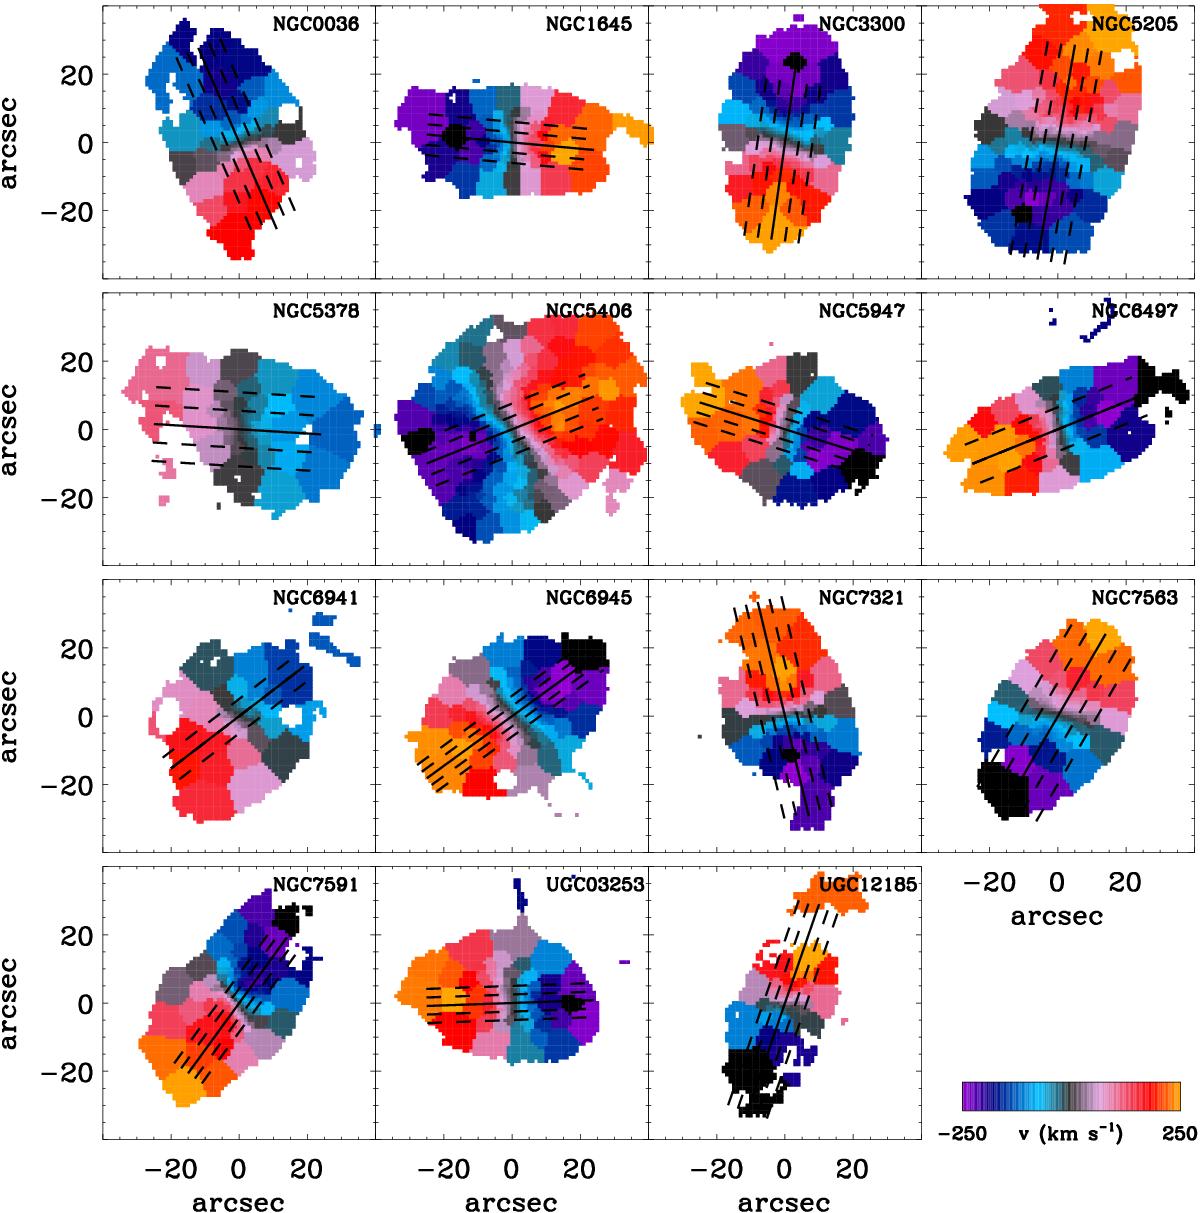
Binned version of the stellar velocity maps of the barred galaxies in our sample. The orientation of the maps is as in Fig. 2. Blue colours represent approaching velocities, while red ones show receding velocities. The full and dashed lines represent the considered slits for measuring the kinematic and photometric integrals. The full line also represent the line of nodes of the galaxy.
Current usage metrics show cumulative count of Article Views (full-text article views including HTML views, PDF and ePub downloads, according to the available data) and Abstracts Views on Vision4Press platform.
Data correspond to usage on the plateform after 2015. The current usage metrics is available 48-96 hours after online publication and is updated daily on week days.
Initial download of the metrics may take a while.