Fig. 7
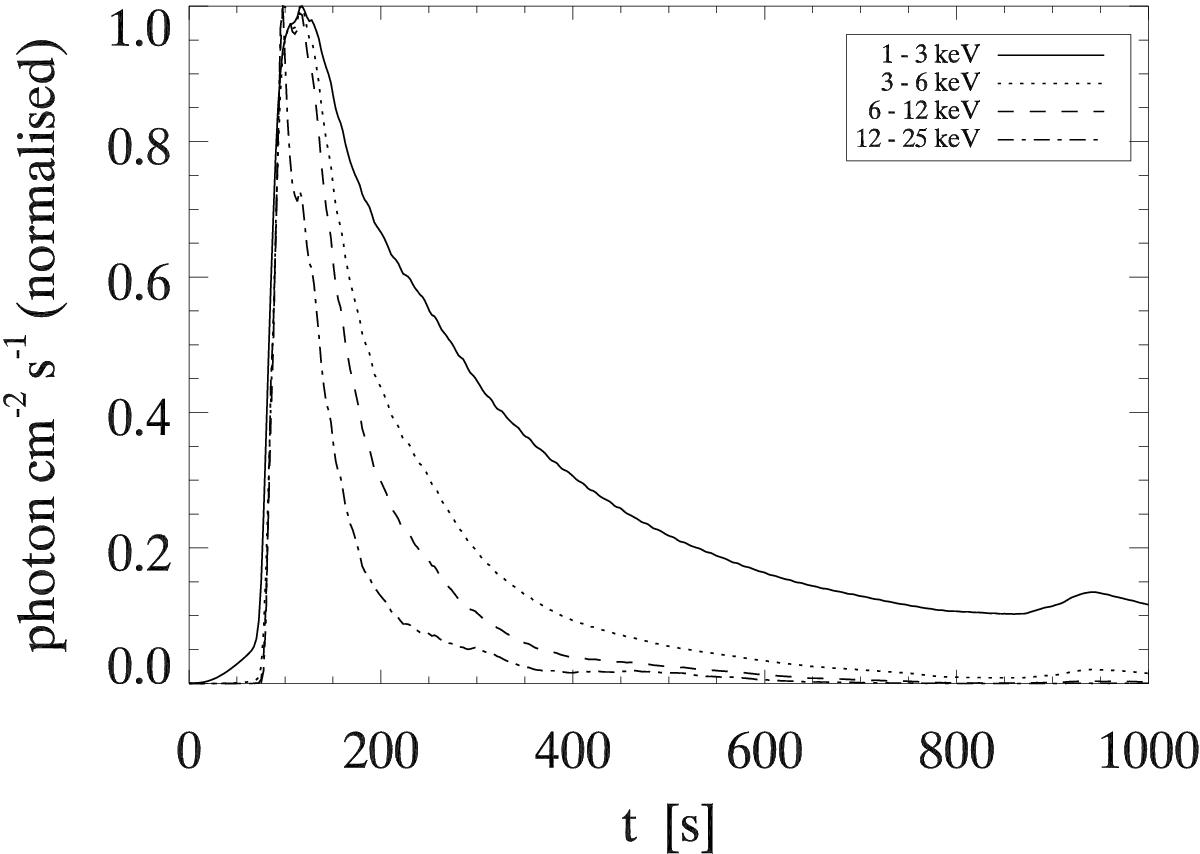
Light curves of X-ray thermal emission at different energy bands for the standard case. The curves are all normalised to their peak value. The inset key shows which energy band corresponds to each line in the plot. Higher energy bands decay faster, lower energy bands decay more slowly. The longest time lag between different peaks is of about 10 s (the lowest energy bands peak earlier).
Current usage metrics show cumulative count of Article Views (full-text article views including HTML views, PDF and ePub downloads, according to the available data) and Abstracts Views on Vision4Press platform.
Data correspond to usage on the plateform after 2015. The current usage metrics is available 48-96 hours after online publication and is updated daily on week days.
Initial download of the metrics may take a while.