Fig. 5
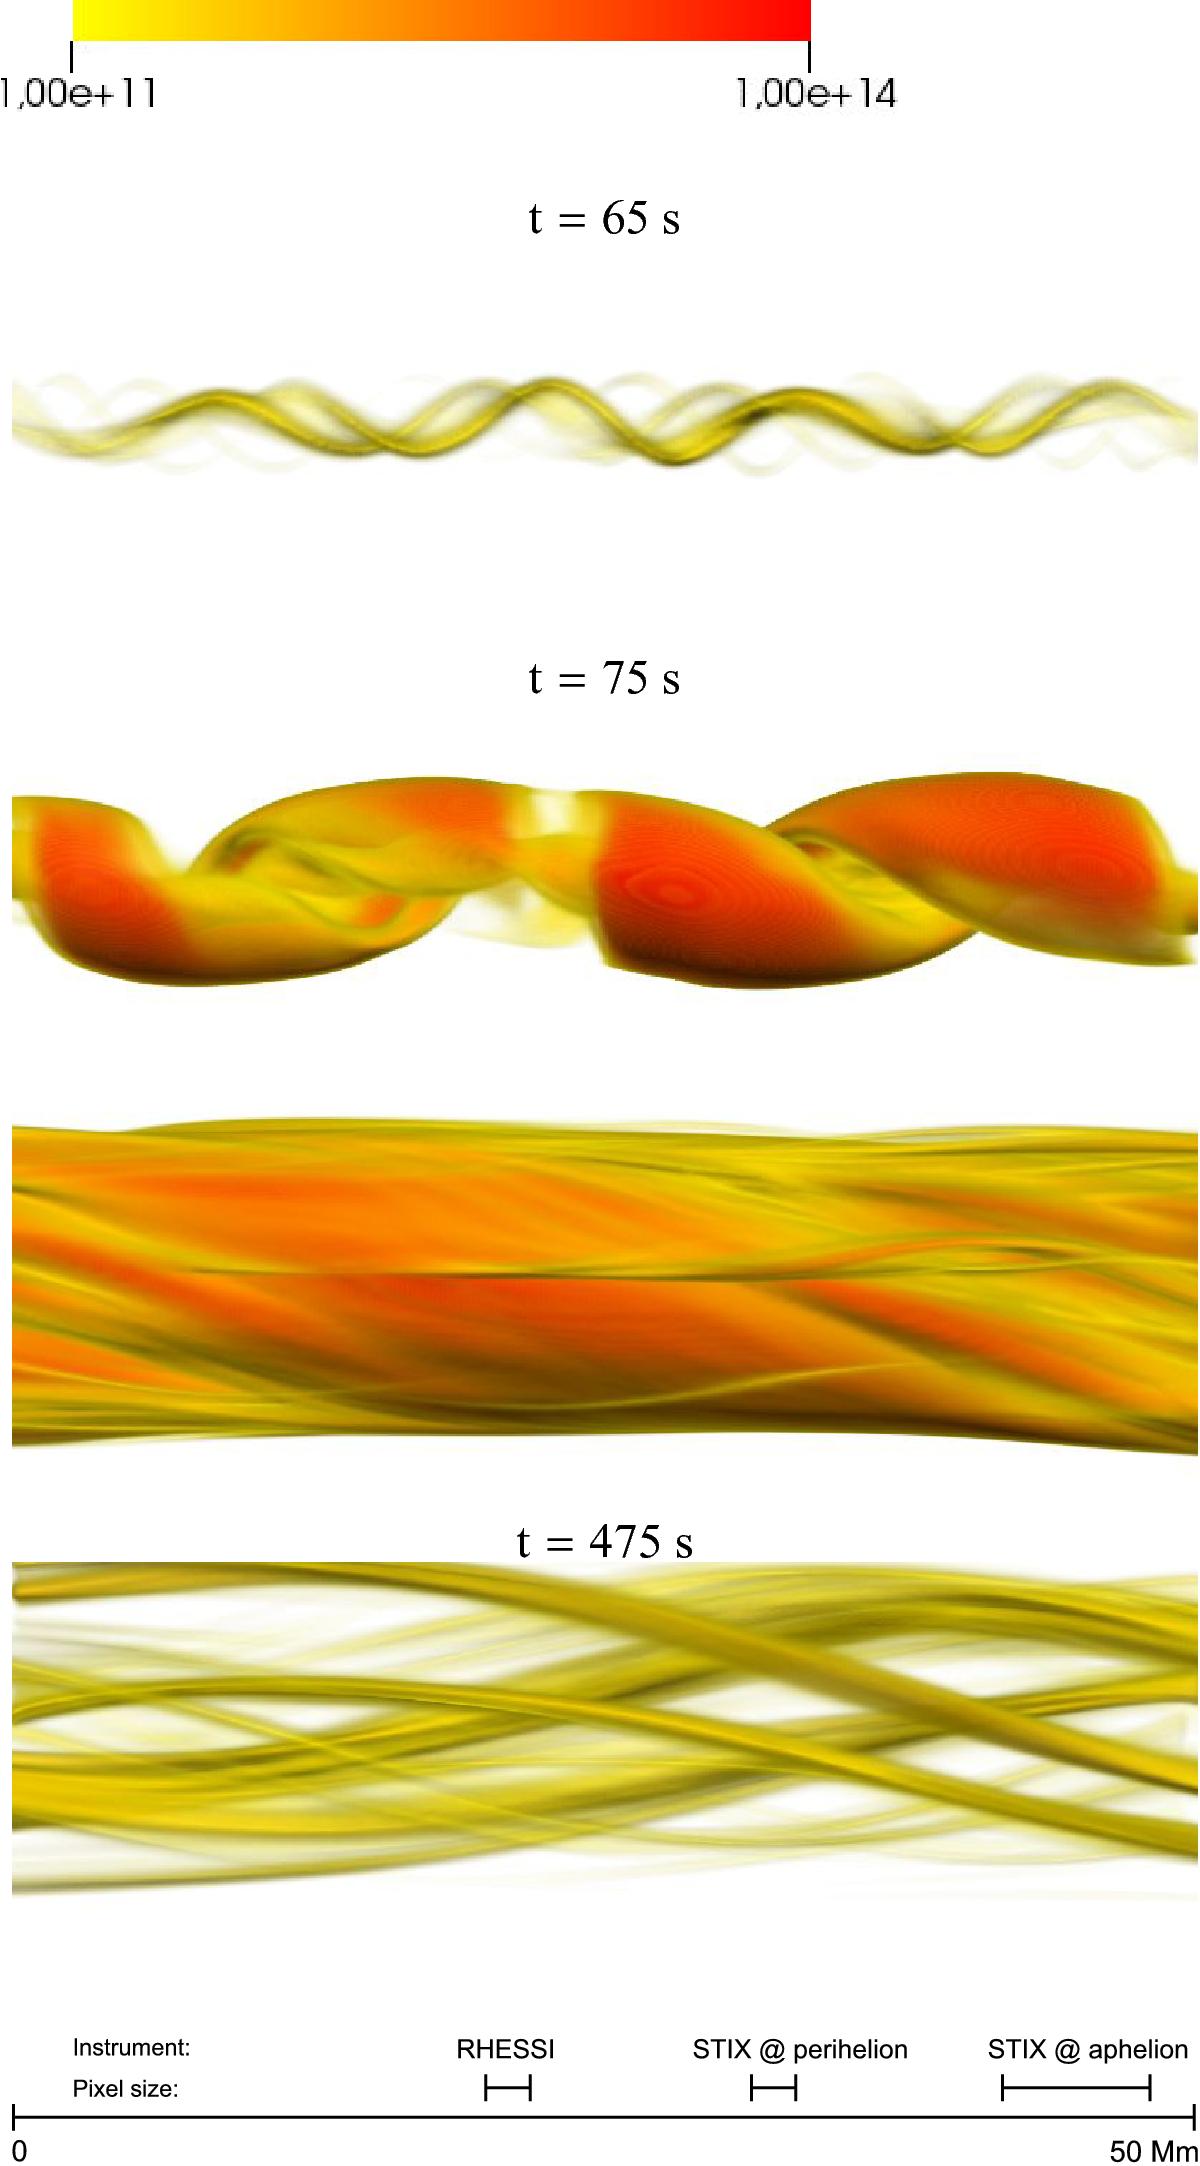
Detail of the continuum emission at 5 keV at different instants for the standard case. The orange/red colour-table represents the emissivity, as defined in Eq. (9). Dark red represents ϵ = 1013 erg s-1 cm-3 Hz-1, a factor 10 stronger than yellow. The instants represented correspond, in order, to the final moments of the linear phase (t = 65 s), to the saturation phase/peak of emission (t = 75 s), to the early relaxation phase (t = 245 s), and to the later relaxation phase (t = 475 s). The scale at the bottom shows the corresponding pixel size for RHESSI and STIX both at the aphelion (~1 AU) and perihelion (~0.3 AU) of the spacecraft orbit. (An associated movie is available online.)
Current usage metrics show cumulative count of Article Views (full-text article views including HTML views, PDF and ePub downloads, according to the available data) and Abstracts Views on Vision4Press platform.
Data correspond to usage on the plateform after 2015. The current usage metrics is available 48-96 hours after online publication and is updated daily on week days.
Initial download of the metrics may take a while.