Fig. 4
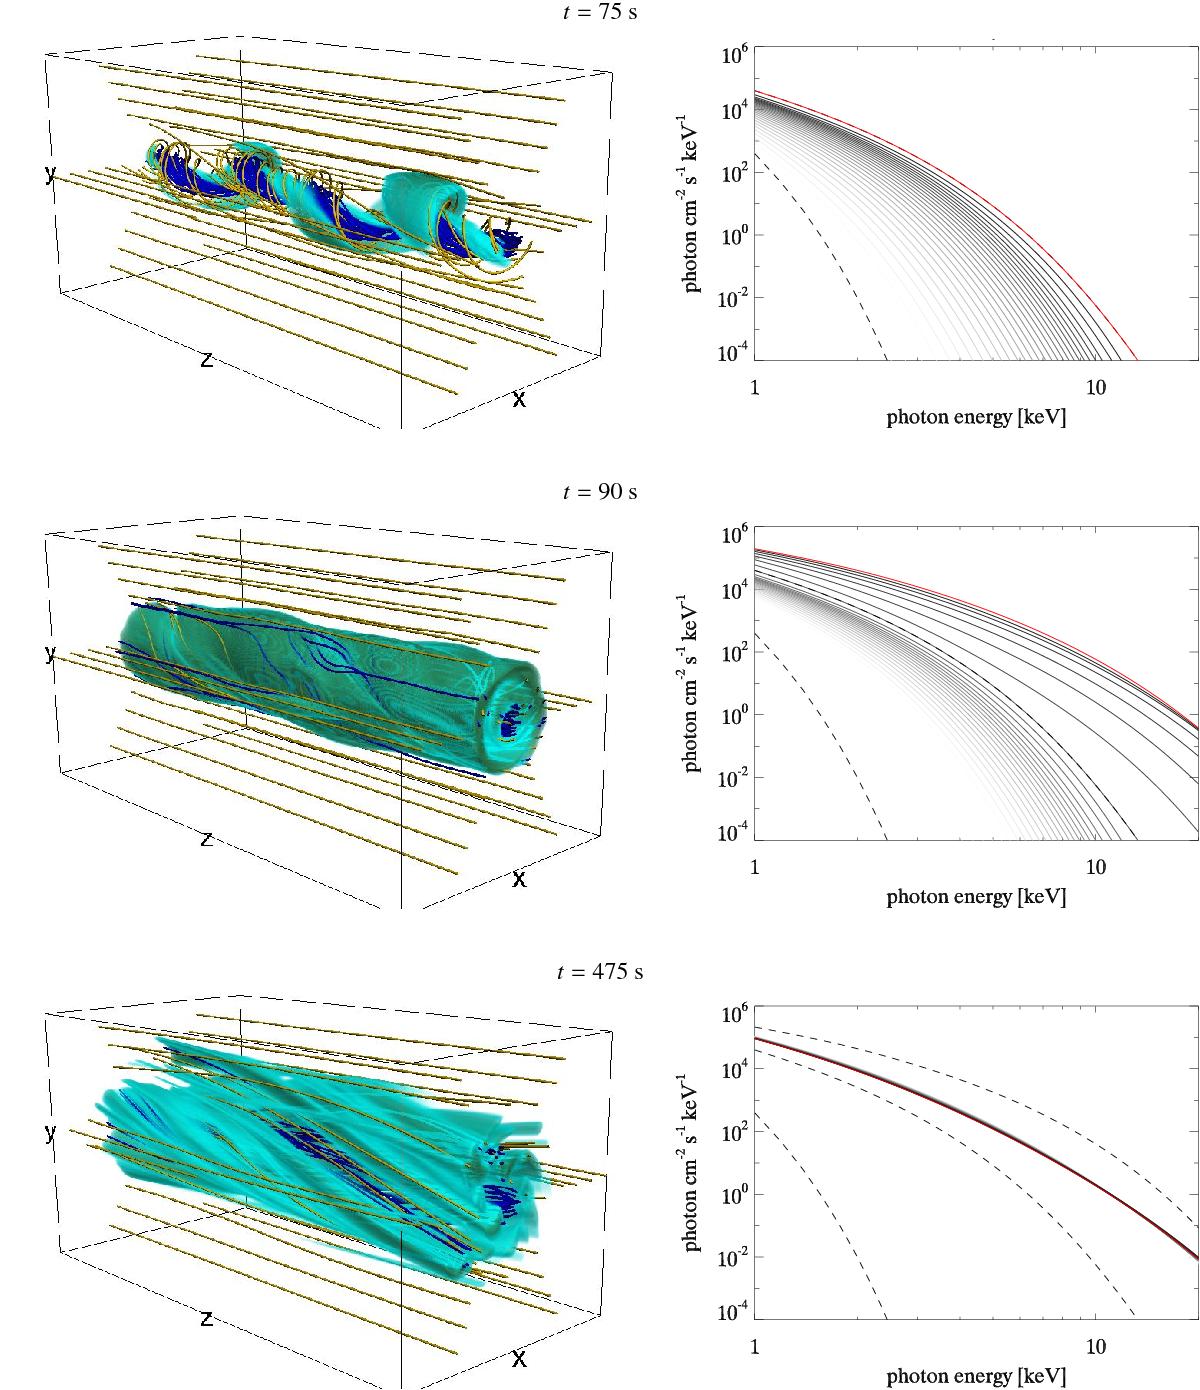
Temporal evolution of the magnetic field, of the emissivity at 10 keV (as defined in Eq. (9)), and of the total emission spectrum (Eq. (11)) in the standard case (see movie online). The instants represented correspond, from top to bottom, to the linear phase (t = 75 s), the saturation phase (t = 90 s) and the relaxation phase (t = 475 s). Left column: three-dimensional renderings of the magnetic field (blue and yellow lines, as in Fig. 2) and of emissivity (green volumes) at these instants. Right column: corresponding emission spectra between 1 and 20 keV. The red lines show the spectra at the same instants as the figures to the left, and the light to dark grey lines show spectra at some preceding instants (with 2.5 s of time-delay between each line), hence giving an idea of the quickness of the evolution of the spectra. The black dashed lines show the initial (t = 0 s), end of linear phase (t ≈ 75 s) and peak spectra (t ≈ 90 s). (An associated movie is available online.)
Current usage metrics show cumulative count of Article Views (full-text article views including HTML views, PDF and ePub downloads, according to the available data) and Abstracts Views on Vision4Press platform.
Data correspond to usage on the plateform after 2015. The current usage metrics is available 48-96 hours after online publication and is updated daily on week days.
Initial download of the metrics may take a while.