Fig. 3
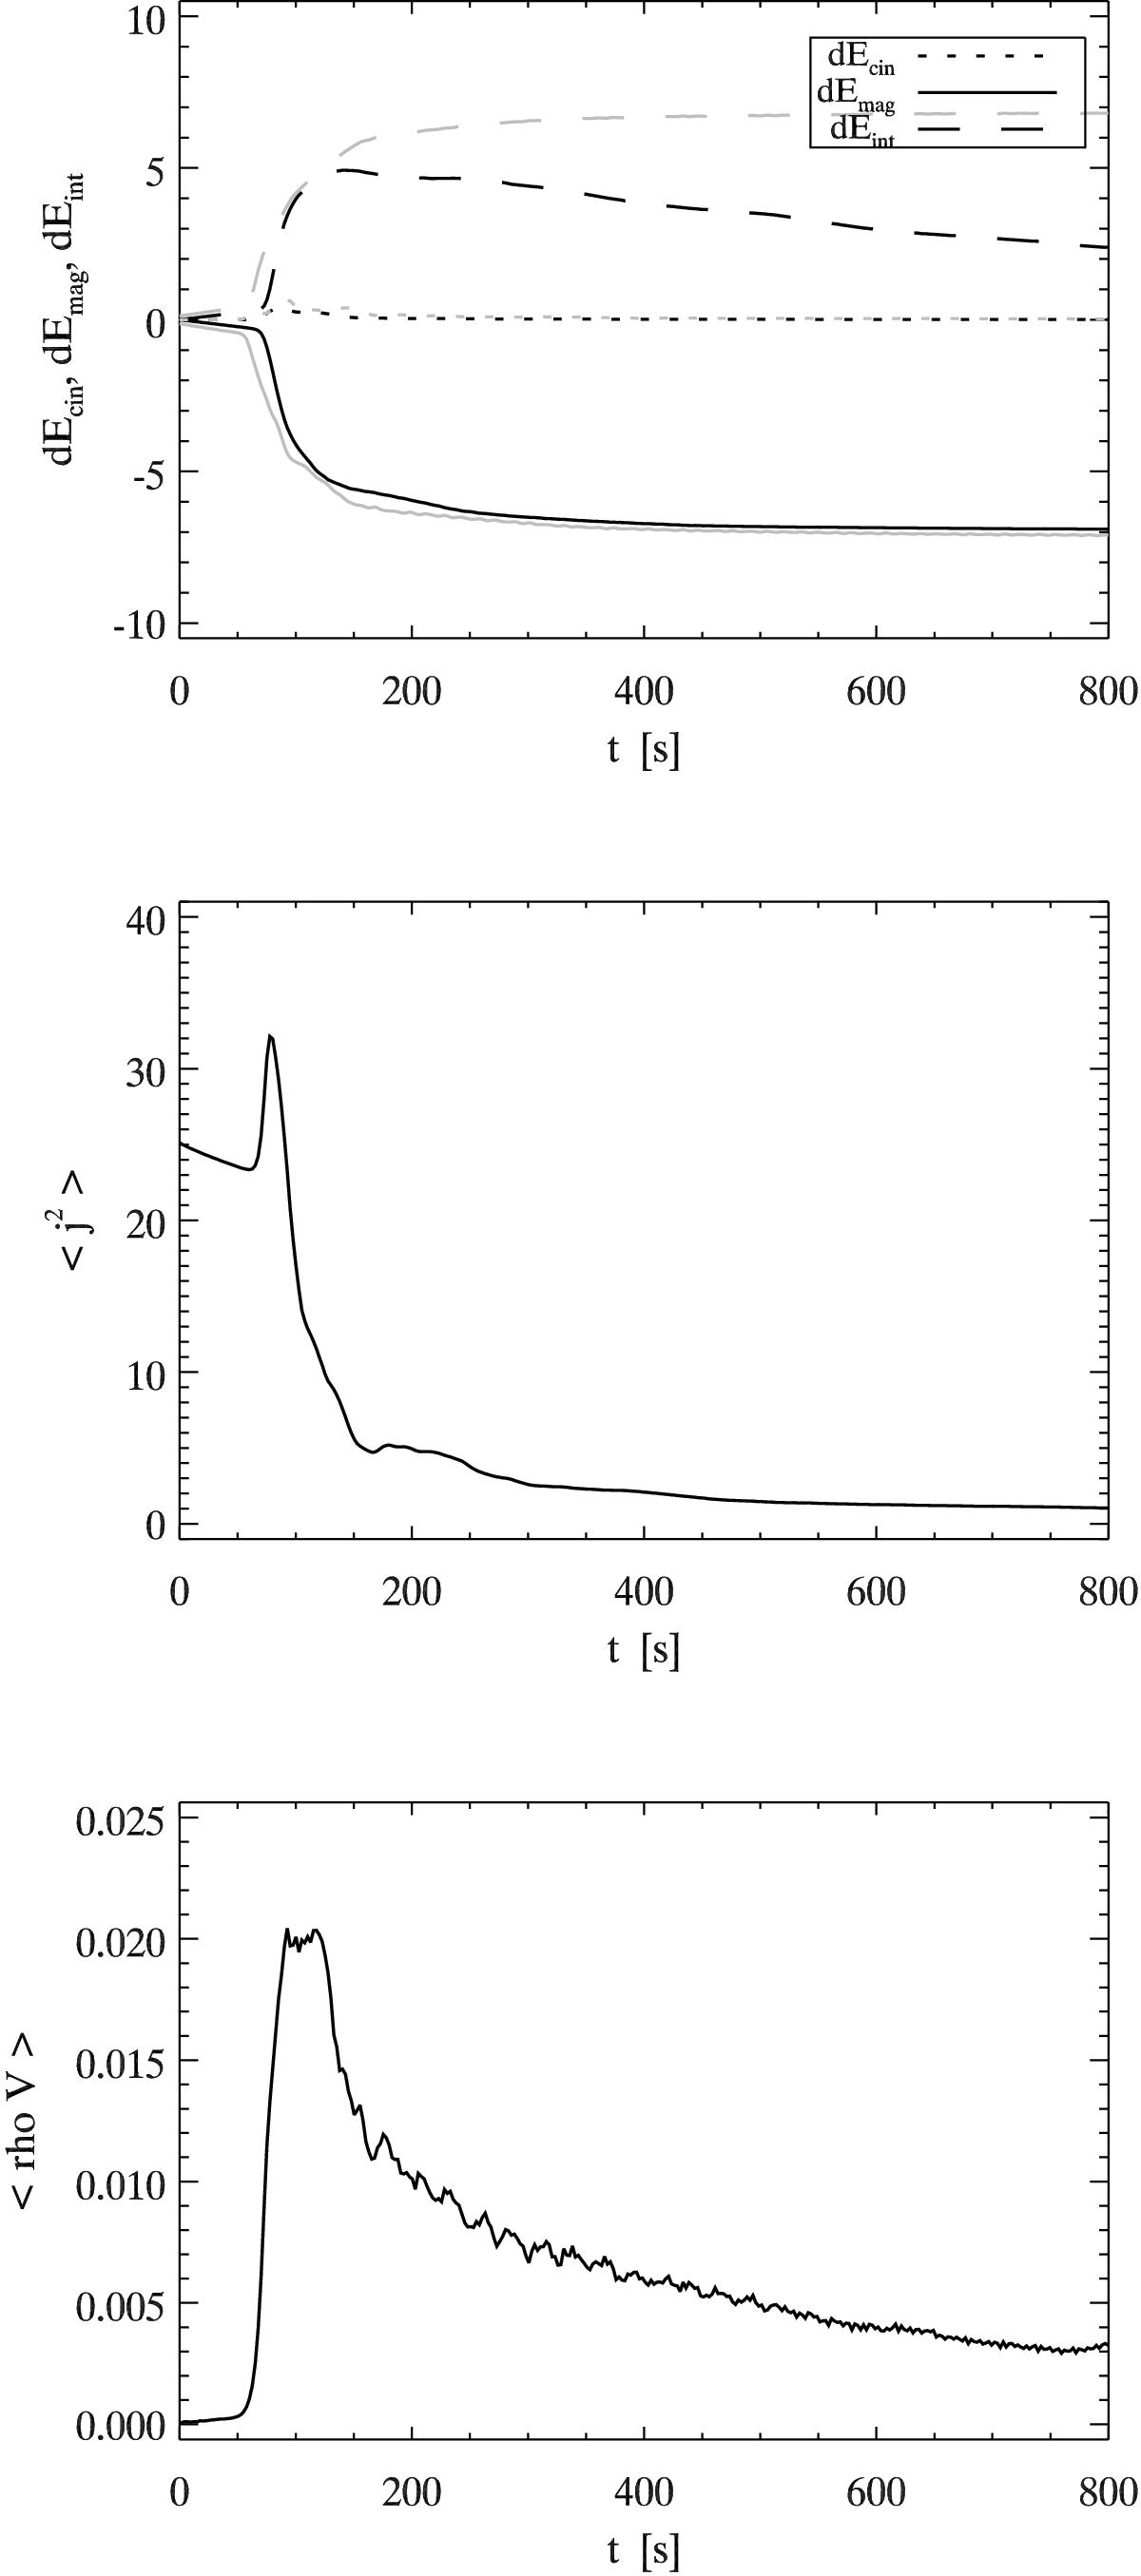
Temporal evolution of the variations in total kinetic, magnetic, and internal energies (ΔEcin, ΔEmag, ΔEint), average current density squared ⟨ j2 ⟩, and average linear momentum ⟨ ρv ⟩ in the standard case (in dimensionless units). The grey lines in the top panel represent the same quantities for a case without thermal conduction for comparison. The total kinetic energy is always lower than the magnetic and internal energies. The thermal conductive flux then begins to grow fast as the plasma quickly heats up locally (as a result of the ohmic dissipation) and is responsible for the decay in internal energy during the relaxation phase (note that in our setup the conductive flux can transport heat outwards through the loop footpoints).
Current usage metrics show cumulative count of Article Views (full-text article views including HTML views, PDF and ePub downloads, according to the available data) and Abstracts Views on Vision4Press platform.
Data correspond to usage on the plateform after 2015. The current usage metrics is available 48-96 hours after online publication and is updated daily on week days.
Initial download of the metrics may take a while.