Fig. 2
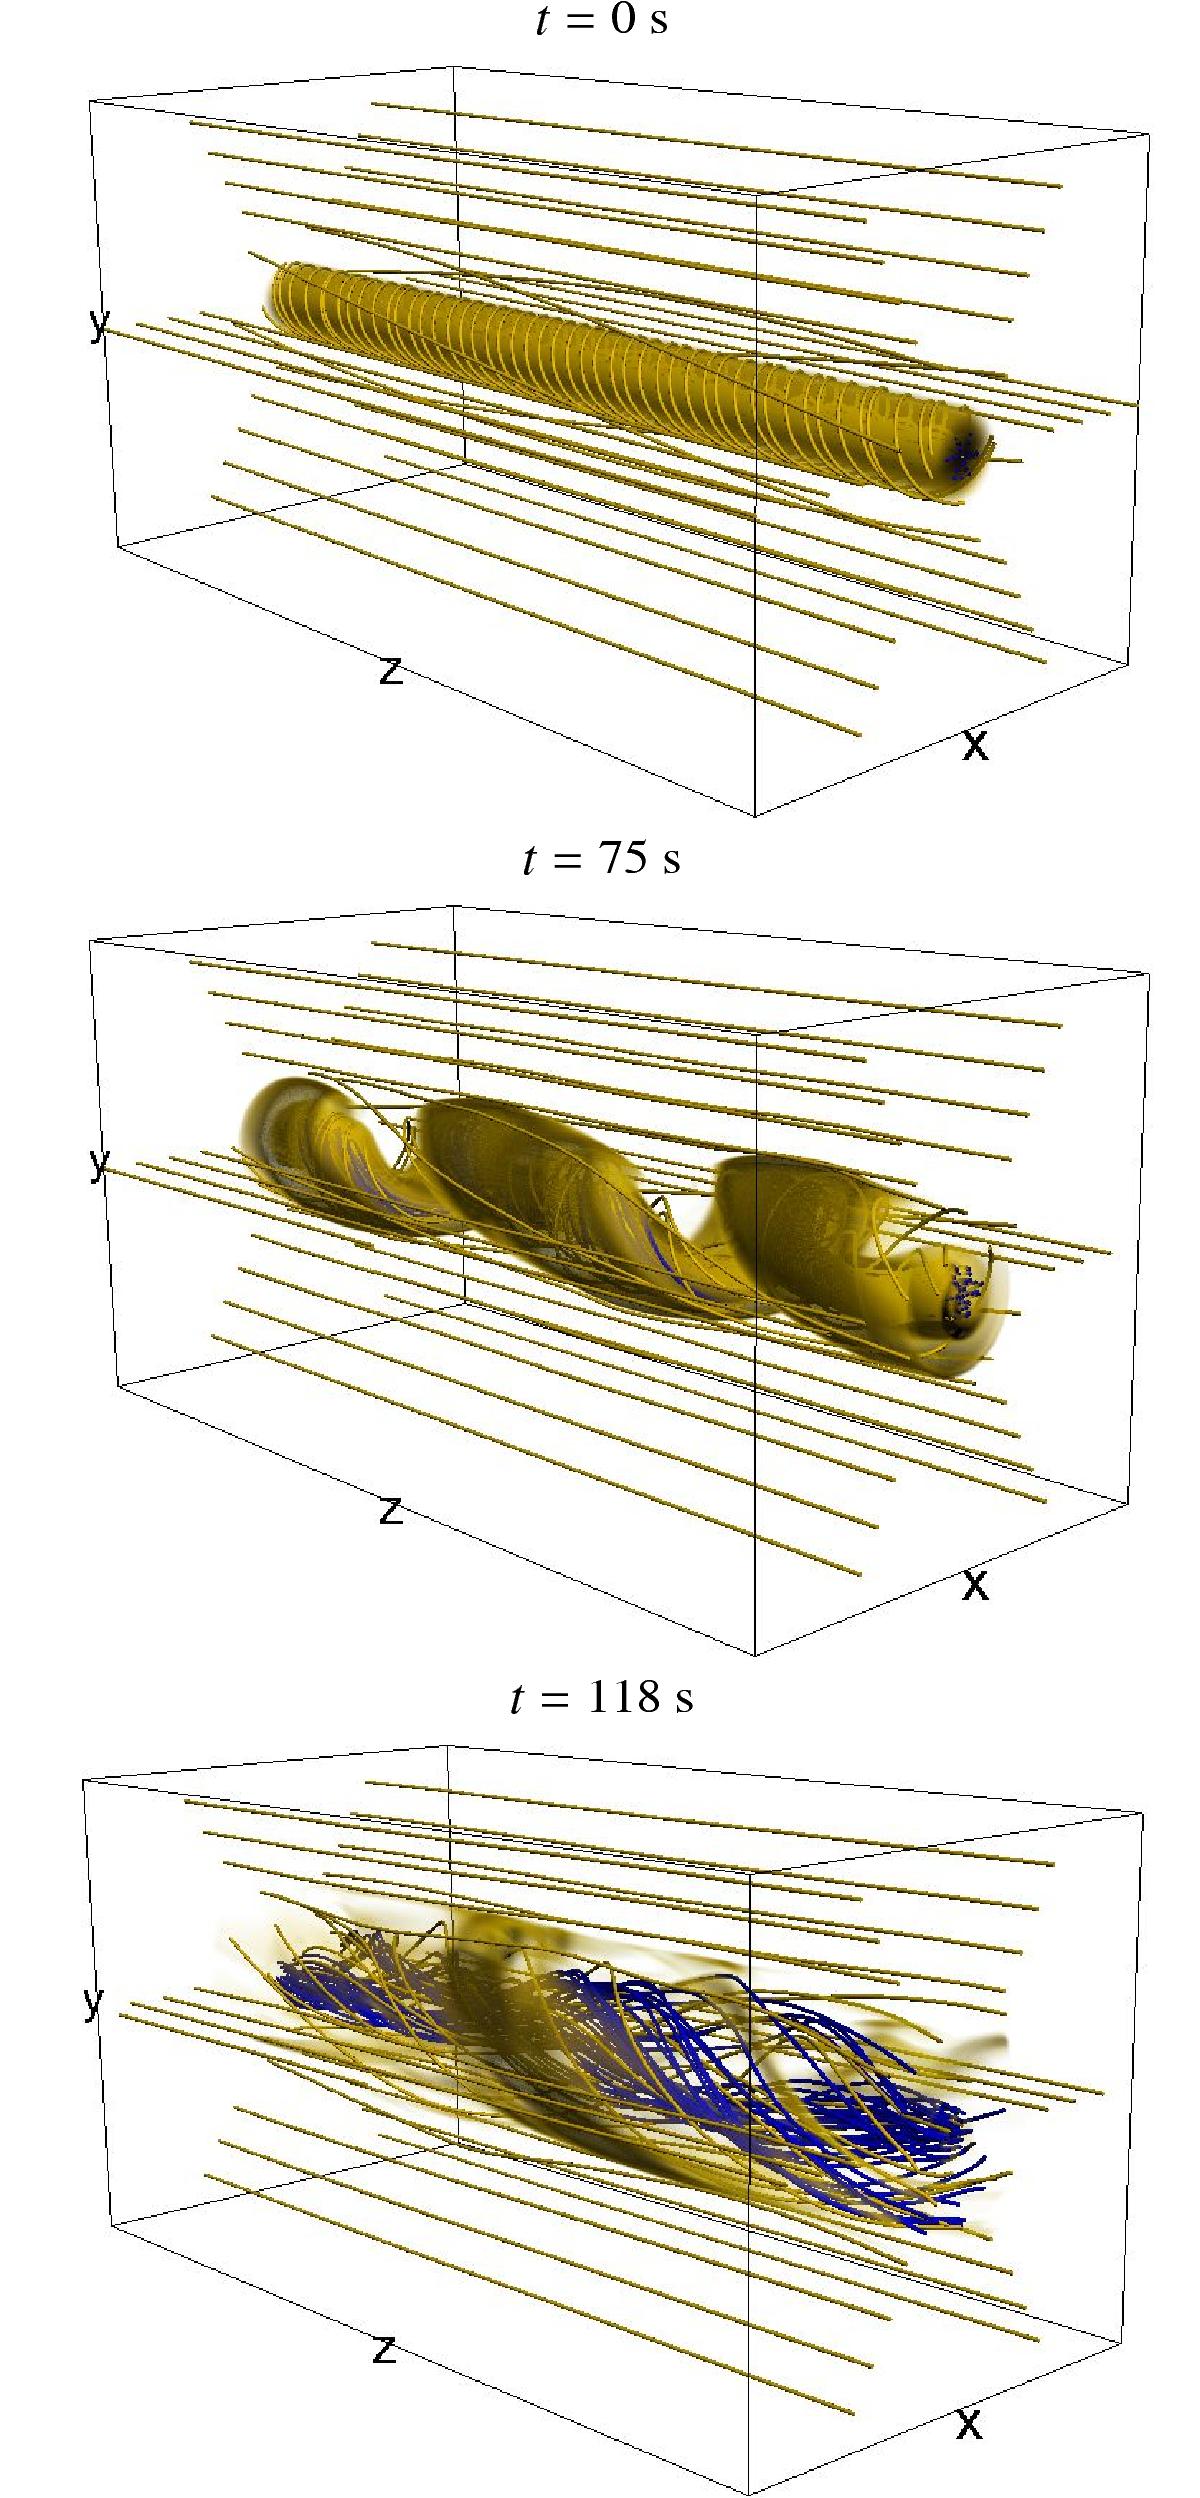
Three snapshots showing the temporal evolution of the magnetic field and the current density in the standard case (Table 1). Blue lines: magnetic field-lines initially placed near the axis of the flux-rope. Yellow lines: magnetic field-lines initially crossing the periphery of the flux rope and the background field. The yellow volumes represent the current density distribution (light/dark yellow corresponding to moderate/strong amplitudes). The inner (blue) magnetic field-lines are concentrated well within the current-carrying region (hence hidden in the first two panels) before the reconnection event takes place. The instants represented correspond to the initial state (t = 0 s), to the peak in magnetic energy release rate (t = 75 s), and to the relaxation phase (t = 118 s).
Current usage metrics show cumulative count of Article Views (full-text article views including HTML views, PDF and ePub downloads, according to the available data) and Abstracts Views on Vision4Press platform.
Data correspond to usage on the plateform after 2015. The current usage metrics is available 48-96 hours after online publication and is updated daily on week days.
Initial download of the metrics may take a while.