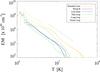
Fig. 11
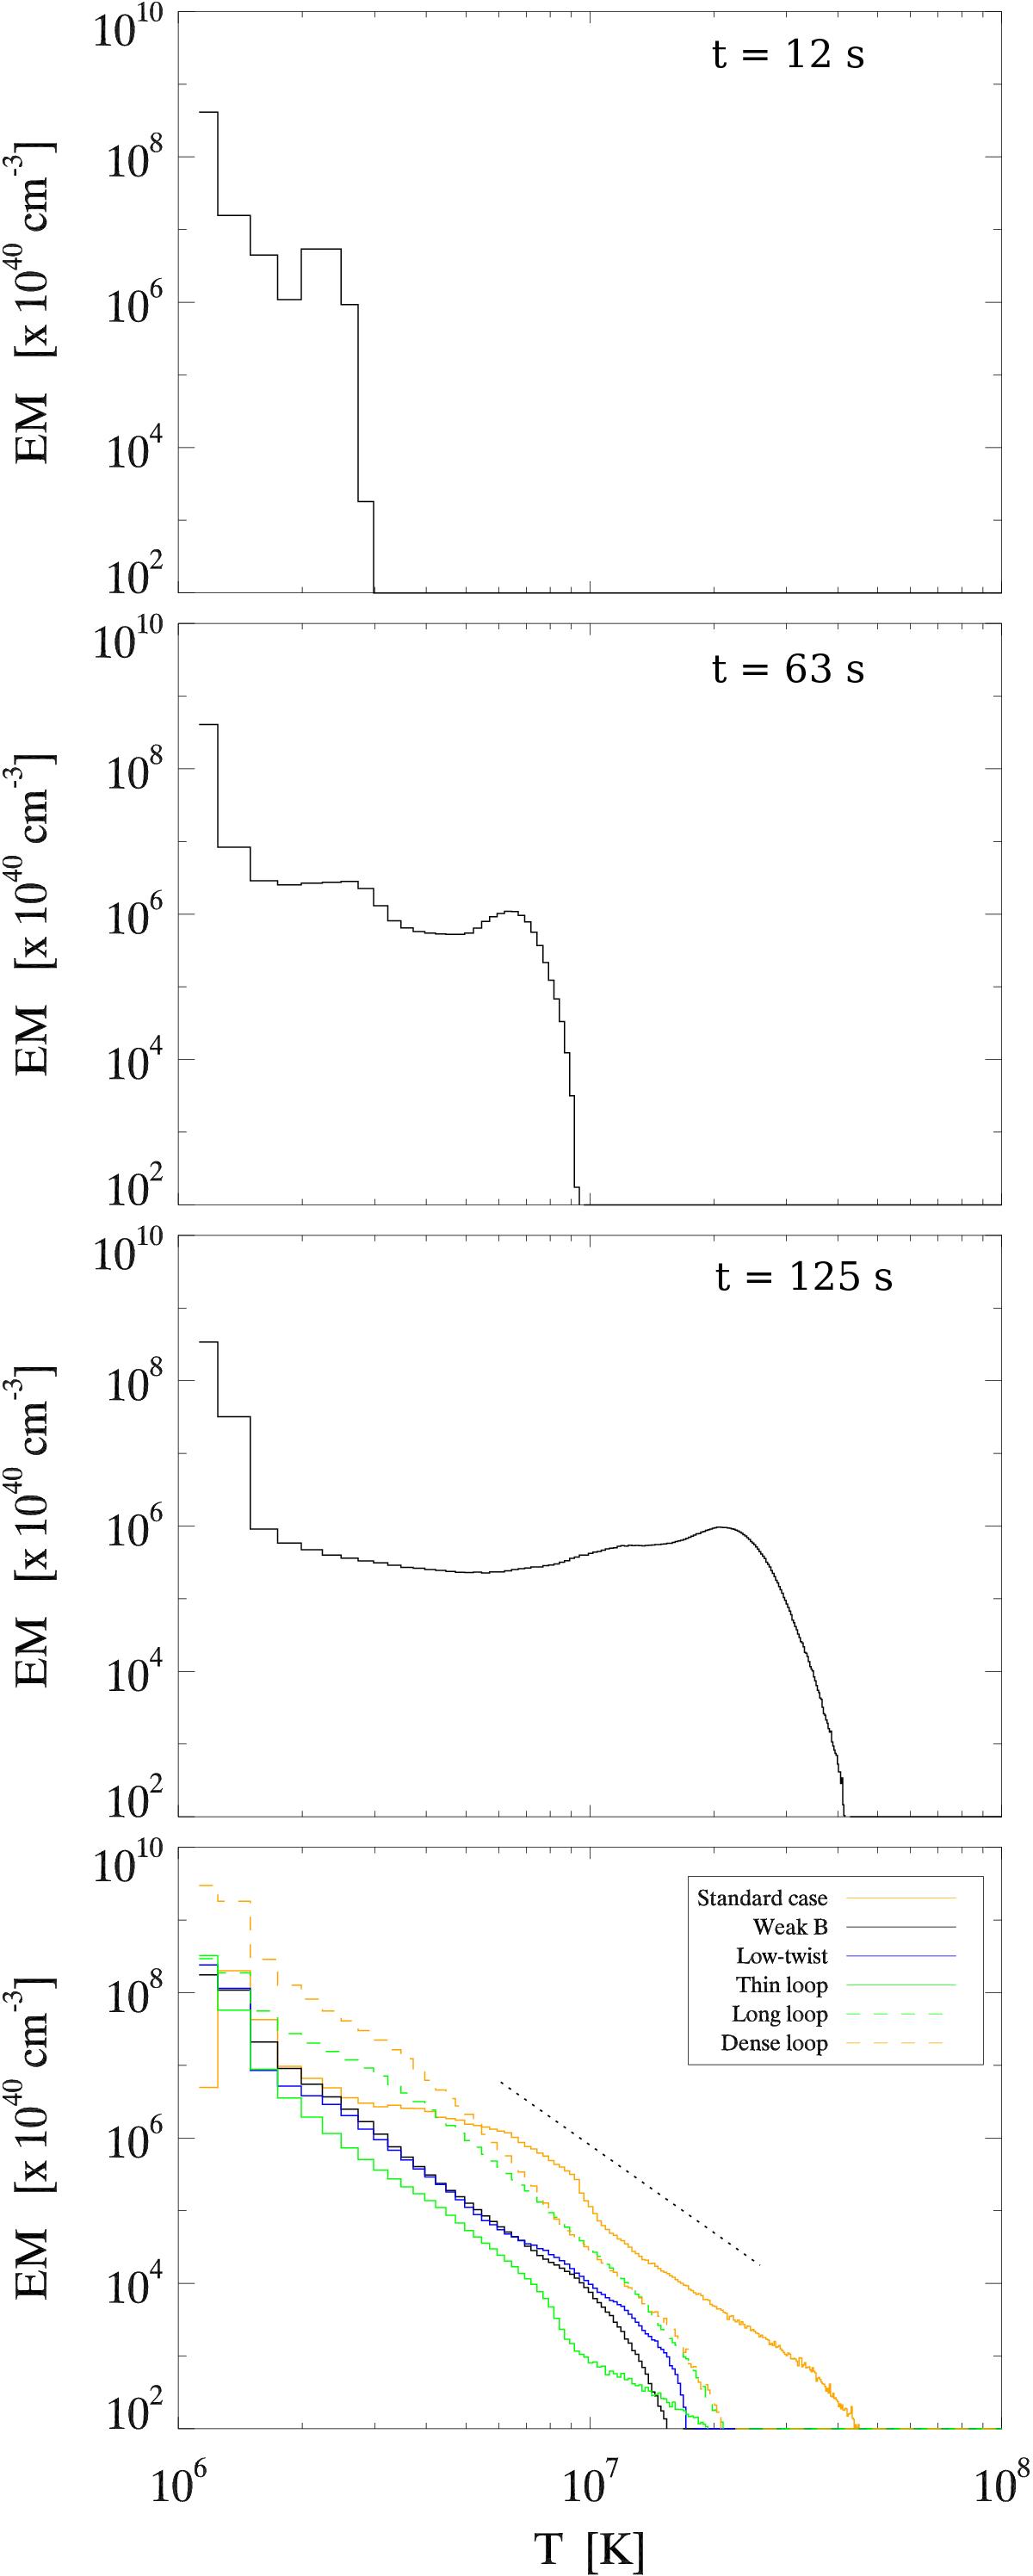
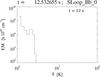
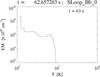
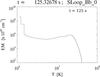
Emission measure as a function of temperature ![]() at different instants, computed with temperature bins of width δT = 2.5 × 10⁵ K. The instant represented in the first three panels are, from top to bottom, t = 12 s (linear phase), t = 63 s (beginning of the saturation phase) and t = 125 s (early stage of the relaxation phase). The initially narrow
at different instants, computed with temperature bins of width δT = 2.5 × 10⁵ K. The instant represented in the first three panels are, from top to bottom, t = 12 s (linear phase), t = 63 s (beginning of the saturation phase) and t = 125 s (early stage of the relaxation phase). The initially narrow ![]() (centred at T0 = 1.2 × 10⁶ K) quickly extends into the higher temperature range as the plasma is strongly heated up during the initial phases. The EM profile then slowly converges to a power-law distribution EM ∝ T-4.2 for T ≳ 2 × 10⁶ K. The last panel represents the relaxation phase at t ≈ 25τA for different cases: the standard case, a case with lower twist, a flux-rope twice as thin, a flux-rope twice as long, a weak-B, and a denser flux-rope. The dotted line indicates the slope of a curve EM ∝ T-4 for visual reference.
(centred at T0 = 1.2 × 10⁶ K) quickly extends into the higher temperature range as the plasma is strongly heated up during the initial phases. The EM profile then slowly converges to a power-law distribution EM ∝ T-4.2 for T ≳ 2 × 10⁶ K. The last panel represents the relaxation phase at t ≈ 25τA for different cases: the standard case, a case with lower twist, a flux-rope twice as thin, a flux-rope twice as long, a weak-B, and a denser flux-rope. The dotted line indicates the slope of a curve EM ∝ T-4 for visual reference.
Current usage metrics show cumulative count of Article Views (full-text article views including HTML views, PDF and ePub downloads, according to the available data) and Abstracts Views on Vision4Press platform.
Data correspond to usage on the plateform after 2015. The current usage metrics is available 48-96 hours after online publication and is updated daily on week days.
Initial download of the metrics may take a while.