Fig. 10
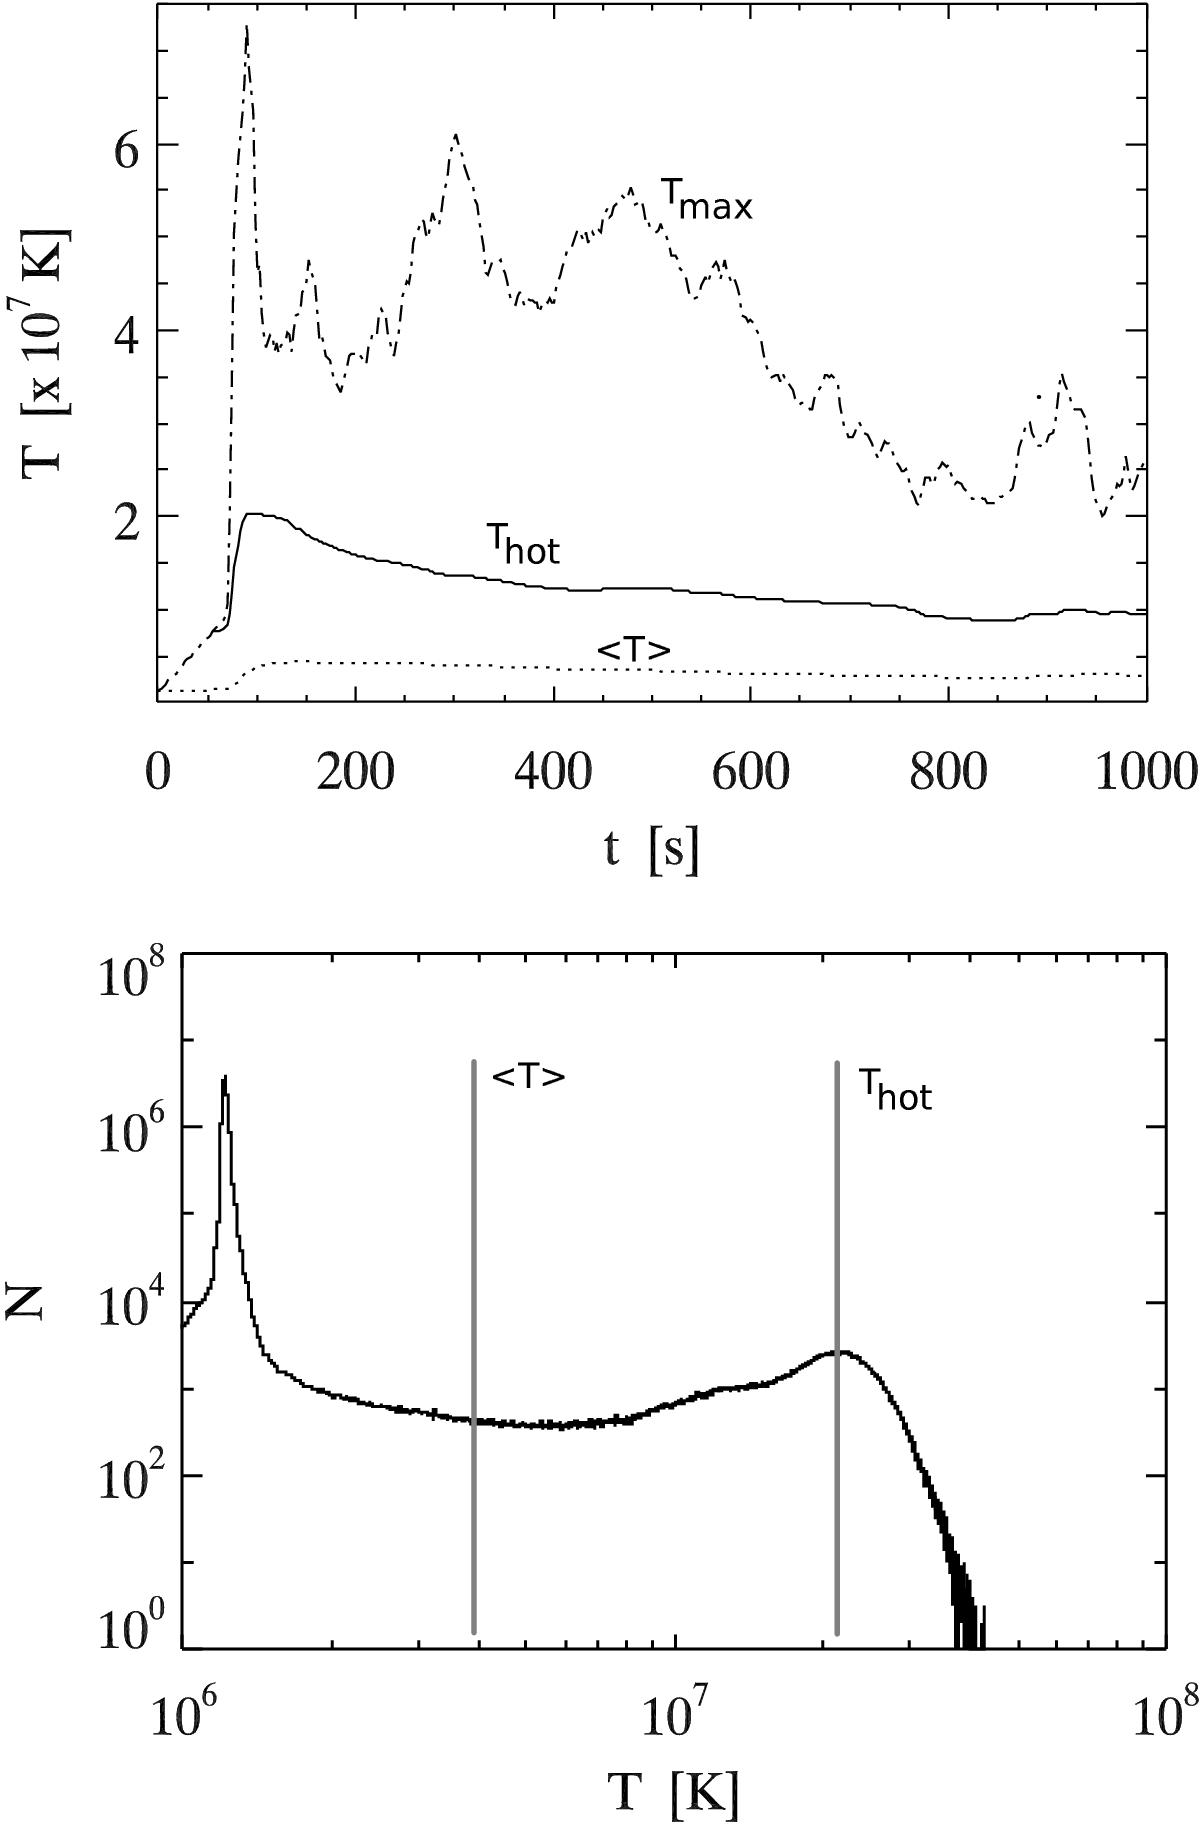
Top panel: temperature Thot corresponding to the average temperature of the bulk of the hot plasma component that develops after the saturation phase (continuous line). The maximum temperature Tmax and the average temperatures ⟨ T ⟩ at each instant are represented by a dotted-dashed line and a dotted line. Bottom panel: histogram of the plasma temperature in the simulation at t = 125 s. The vertical lines in the bottom plot mark the positions of the hot-plasma-component temperature and of the volume-averaged temperatures (Thot and ⟨ T ⟩).
Current usage metrics show cumulative count of Article Views (full-text article views including HTML views, PDF and ePub downloads, according to the available data) and Abstracts Views on Vision4Press platform.
Data correspond to usage on the plateform after 2015. The current usage metrics is available 48-96 hours after online publication and is updated daily on week days.
Initial download of the metrics may take a while.