Fig. 1
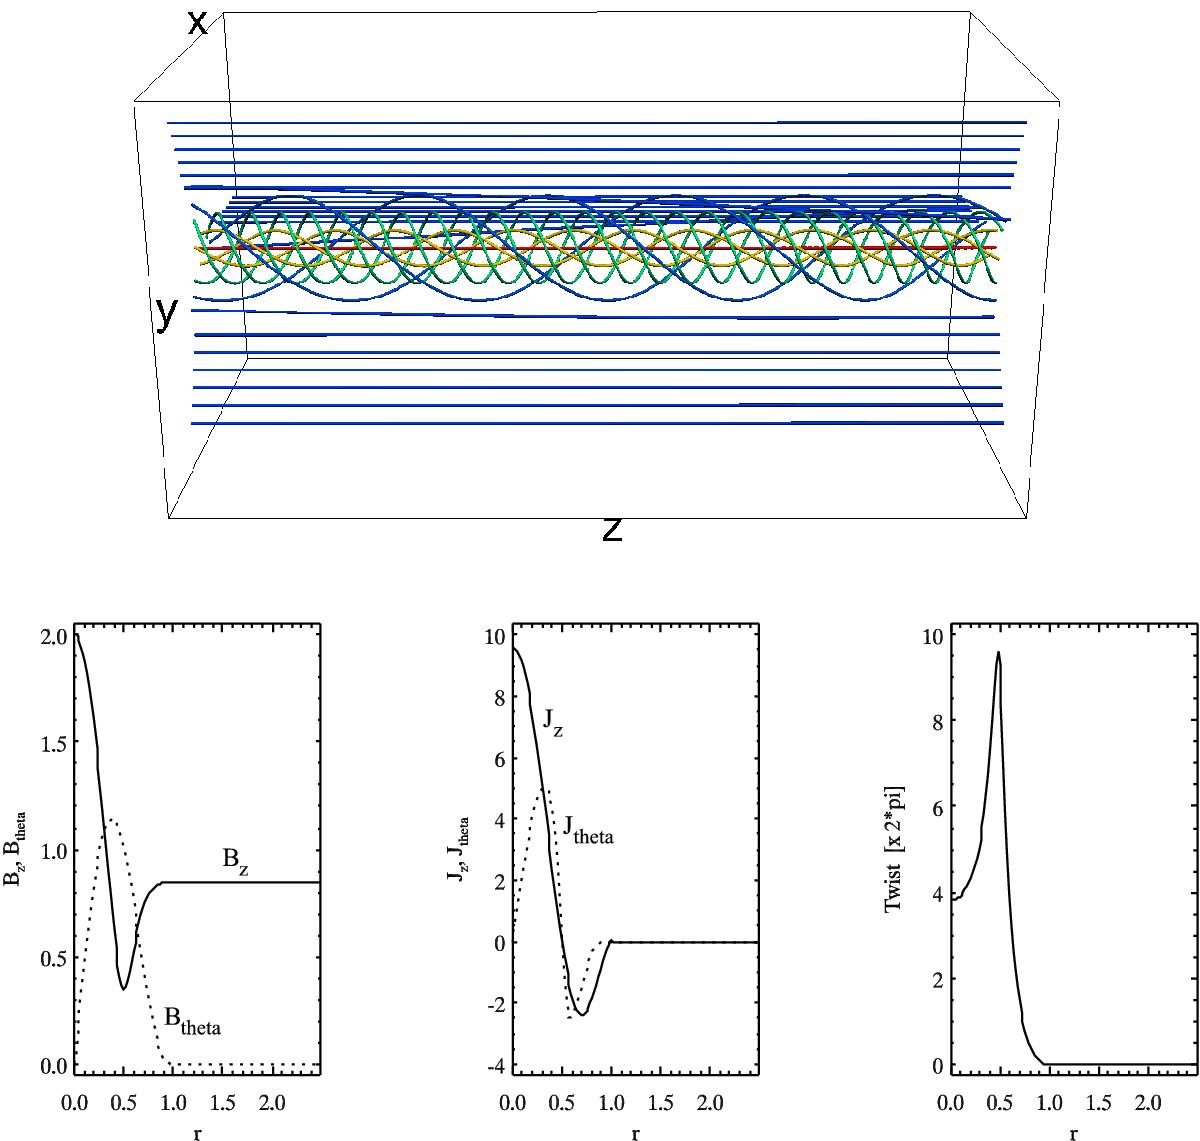
Initial conditions for the standard case (magnetic field properties alone; see Table 1). The three-dimensional picture on the top shows a sample of magnetic field lines (coloured according to the magnetic field strength). The plots below show the amplitude of the magnetic field components Bz and Bθ, the current density components Jz and Jθ (with J = ∇ × B/μ0) and the twist angle ![]() as a function of the radial distance r to the flux-rope axis. All quantities are shown in dimensionless units; these can be converted into physical values (for our standard case) using the rightmost values in Table 1. Continuous lines represent the axial components (along
as a function of the radial distance r to the flux-rope axis. All quantities are shown in dimensionless units; these can be converted into physical values (for our standard case) using the rightmost values in Table 1. Continuous lines represent the axial components (along ![]() ), while the dotted lines represent the azimuthal components (along
), while the dotted lines represent the azimuthal components (along ![]() ) of B and J.
) of B and J.
Current usage metrics show cumulative count of Article Views (full-text article views including HTML views, PDF and ePub downloads, according to the available data) and Abstracts Views on Vision4Press platform.
Data correspond to usage on the plateform after 2015. The current usage metrics is available 48-96 hours after online publication and is updated daily on week days.
Initial download of the metrics may take a while.