Fig. 6
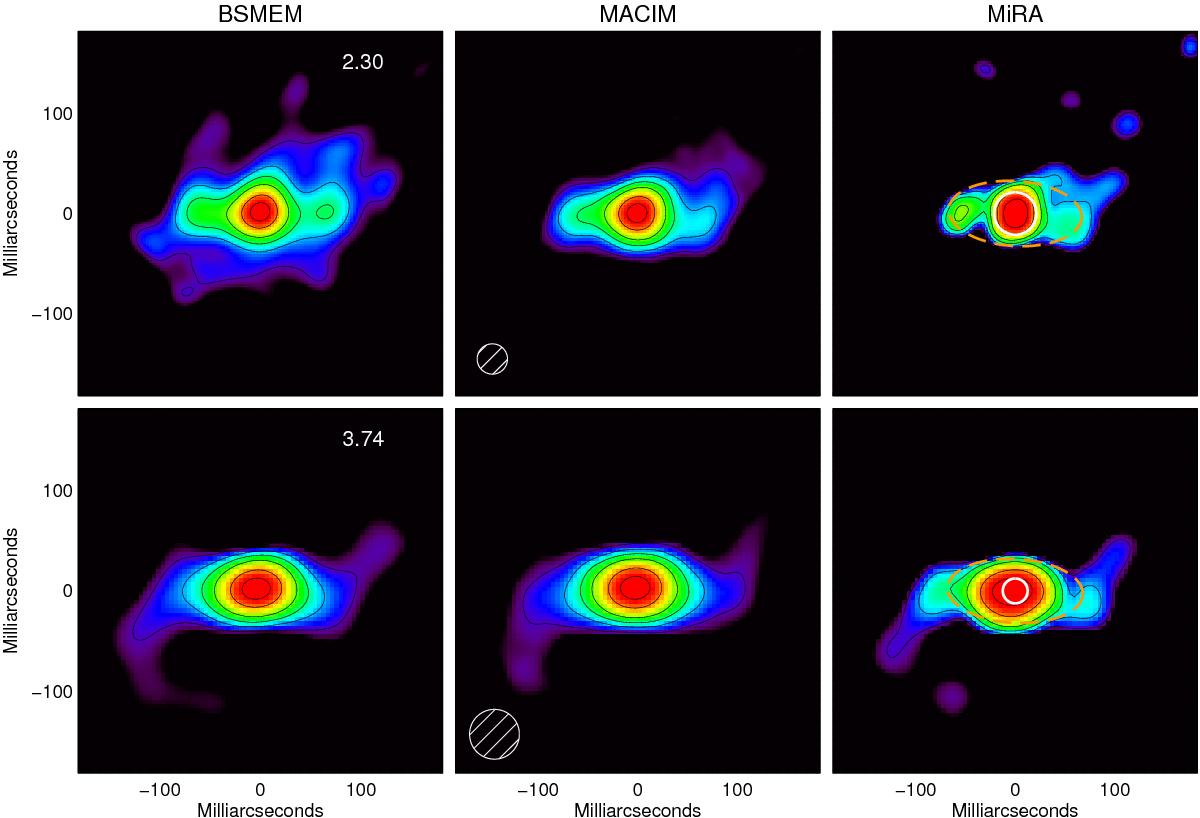
Comparison of image reconstruction for SAM maps at 2.30 μm (top) and 3.74 μm (bottom) from December 2012. Each column, from left to right, represents image reconstructions with BSMEM, MACIM, and MiRA. Contour levels and orientation are as in Fig. 5. The resolution elements of SAM for the respective wavelengths are shown in the lower left corner of the second column. GEM-FIND model fits are overplotted in the third column for comparison: elliptical Gaussian (FWHM; orange) and circular uniform disk (white). The extent and size of the fitted models is similar to those of the mapped structures down to 5% of the peak intensity, while ≥70% of the emission originates from the central star. At 2.30 μm two clumpy patterns emerge in the east–west direction with a possible hook-like pattern rising in the north–east. The former are unresolved at 3.74 μm, and the shape now resembles a bar with two hook-like patterns emerging in the north–east and south–west directions.
Current usage metrics show cumulative count of Article Views (full-text article views including HTML views, PDF and ePub downloads, according to the available data) and Abstracts Views on Vision4Press platform.
Data correspond to usage on the plateform after 2015. The current usage metrics is available 48-96 hours after online publication and is updated daily on week days.
Initial download of the metrics may take a while.