Free Access
Fig. 2
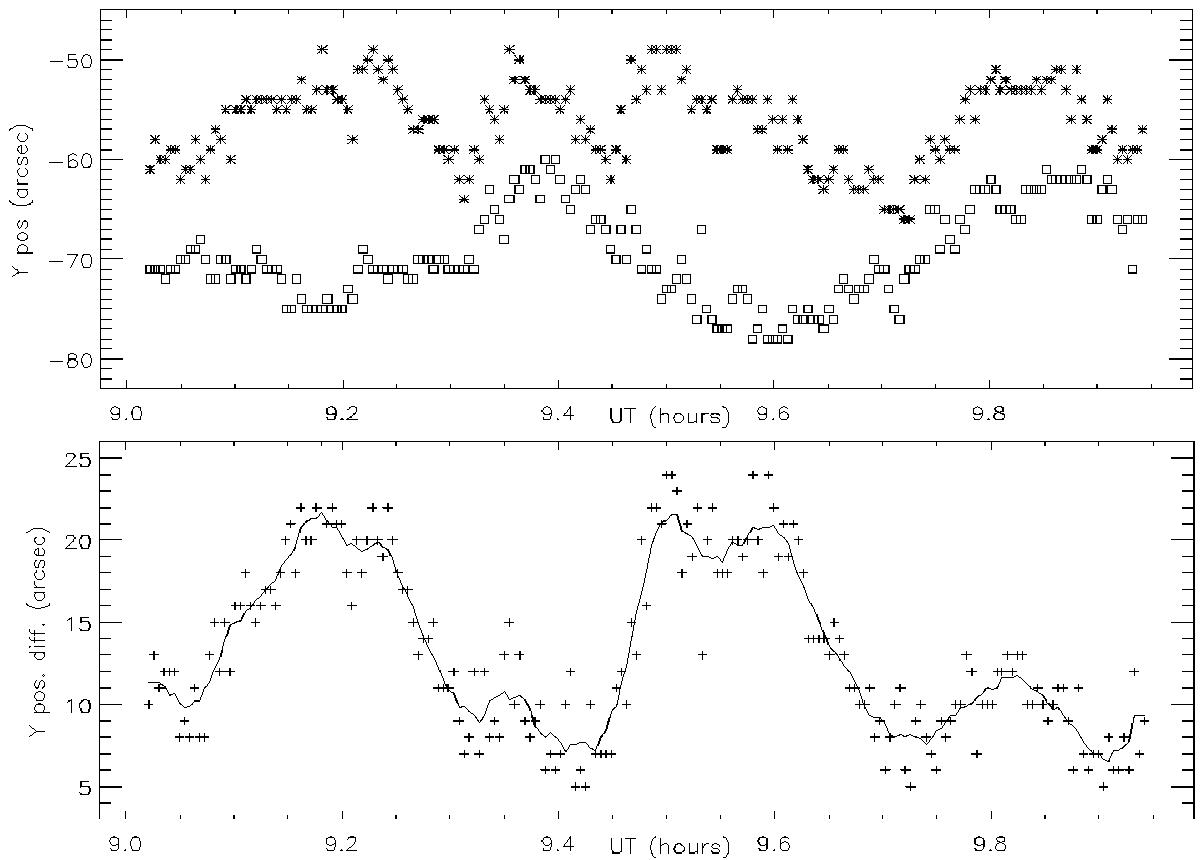
Top: NS positions (arcsec) versus time (UT) for the main noise storm on Aug. 27, 2002 for NRH (squares) and GMRT (asterisks). Bottom: difference between GMRT and NRH NS positions (arcsec). The continuous curve gives the sliding average over two minutes.
This figure is made of several images, please see below:
Current usage metrics show cumulative count of Article Views (full-text article views including HTML views, PDF and ePub downloads, according to the available data) and Abstracts Views on Vision4Press platform.
Data correspond to usage on the plateform after 2015. The current usage metrics is available 48-96 hours after online publication and is updated daily on week days.
Initial download of the metrics may take a while.