Fig. 1
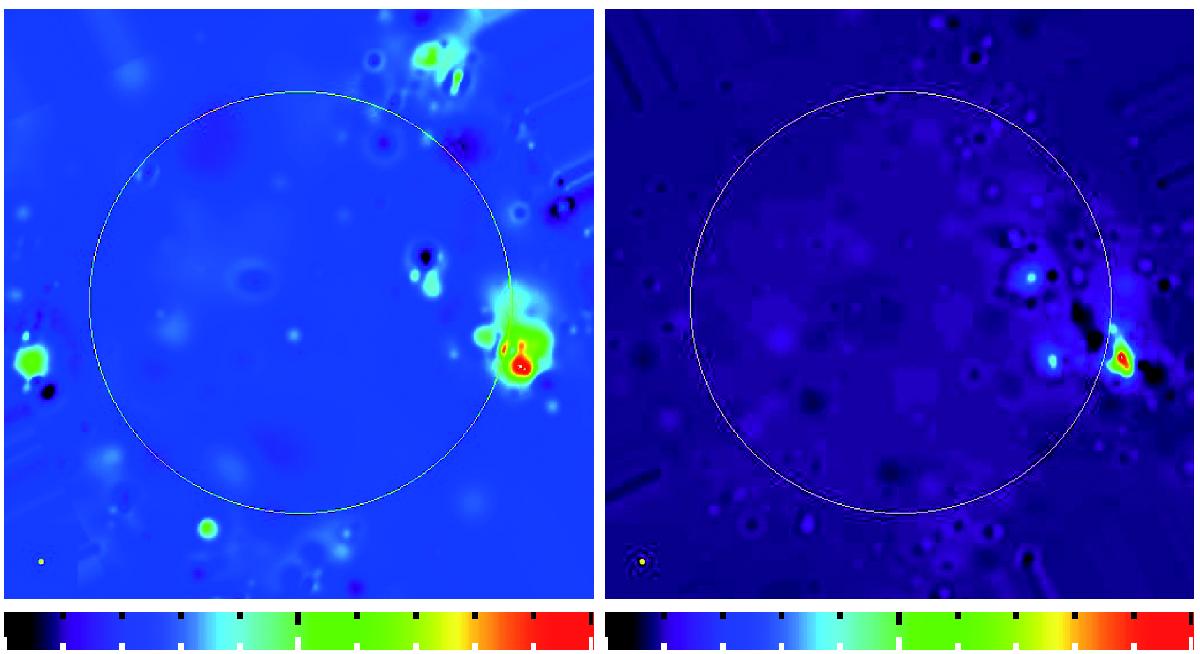
Examples of images with the GMRT alone (left) and with NRH+GMRT (right) for a complex situation on Apr. 06, 2006 at 10:01:28 UT. The intensity scale (shown at bottom) is linear from black (lowest level) to red (highest level). The color of the background (zero level) results from the value of the deepest negative artifact. This color scale makes low-level negative artifacts more visible than the linear black and white scale. The resolution (~20 arcsec) is indicated at bottom left. The circle is the optical limb.
Current usage metrics show cumulative count of Article Views (full-text article views including HTML views, PDF and ePub downloads, according to the available data) and Abstracts Views on Vision4Press platform.
Data correspond to usage on the plateform after 2015. The current usage metrics is available 48-96 hours after online publication and is updated daily on week days.
Initial download of the metrics may take a while.