Fig. 1
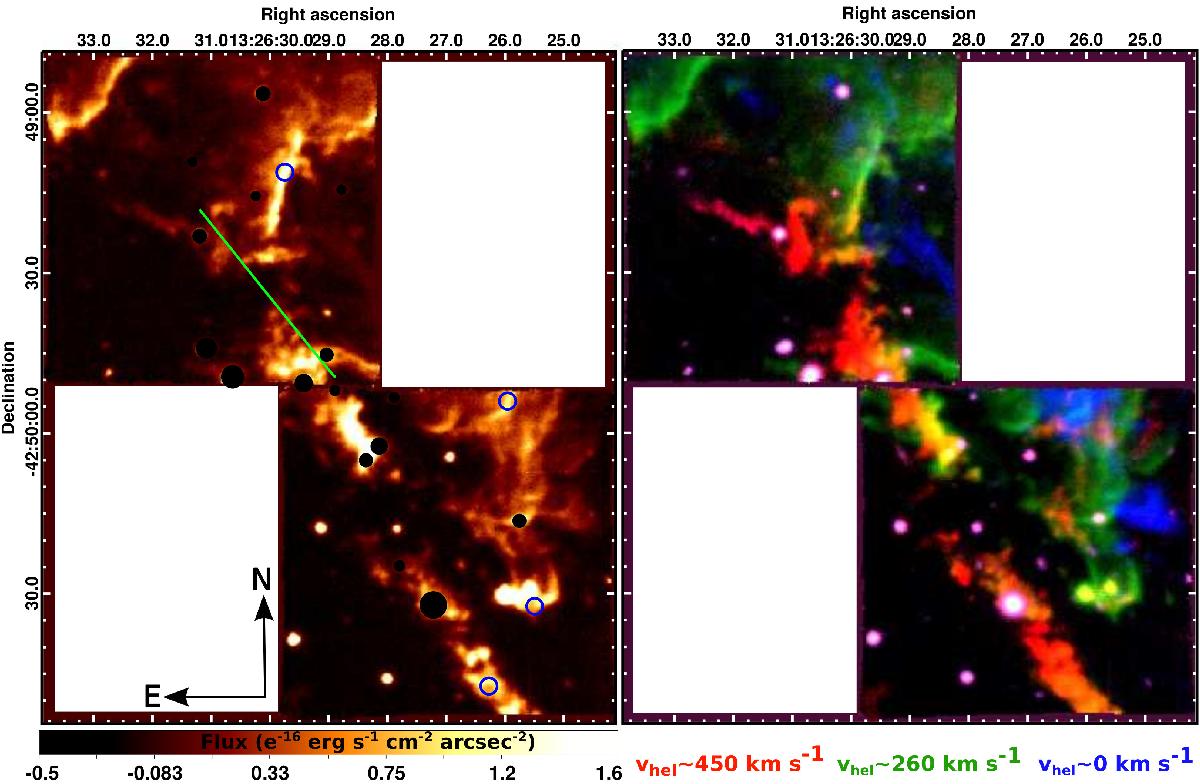
Left panel: total Hα line flux map. Blue circles mark the regions from which the spectra shown in Fig. 3 are extracted (from top to bottom: diffuse component, low-velocity component, arc-like clumps, linear component). Black-filled circles mark the stellar light that is superimposed on the ionized gas emission. The location of the position-velocity plot of Fig. 2 is indicated with a green line. Right panel: RGB image of the Hα emission showing the linear (red), the diffuse (green) and the low-velocity (blue) components. At the bottom we indicate the intensity weighted mean heliocentric velocity of each component; note that Cen A vsys ~ 540kms-1. The regions where the overlap between the linear and the diffuse components is more evident are plotted in yellow.
Current usage metrics show cumulative count of Article Views (full-text article views including HTML views, PDF and ePub downloads, according to the available data) and Abstracts Views on Vision4Press platform.
Data correspond to usage on the plateform after 2015. The current usage metrics is available 48-96 hours after online publication and is updated daily on week days.
Initial download of the metrics may take a while.