Fig. 13
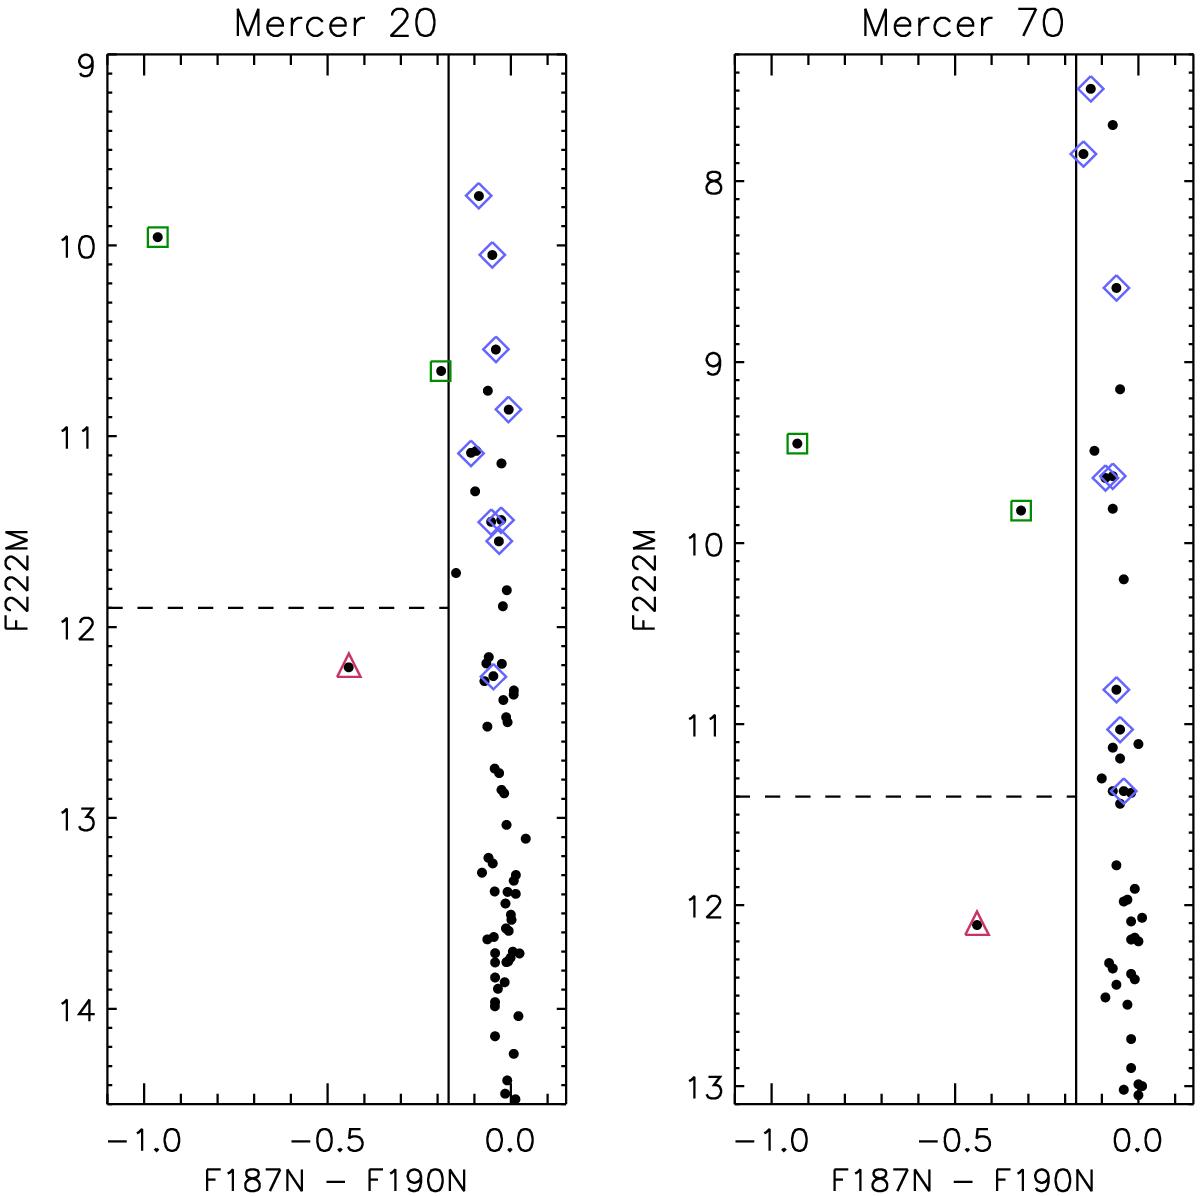
Pα-magnitude diagram of the Mc20 and Mc70 fields. Red triangles are FS CMa stars, green squares are WR or “slash” stars and blue diamonds are OB cluster members. For the sake of clarity, GLIMPSE20-1 is excluded for being situated far away from the magnitude range drawn here. The solid line shows our adopted limit for Pα excess and the dashed line is at MK ≈ −4.
Current usage metrics show cumulative count of Article Views (full-text article views including HTML views, PDF and ePub downloads, according to the available data) and Abstracts Views on Vision4Press platform.
Data correspond to usage on the plateform after 2015. The current usage metrics is available 48-96 hours after online publication and is updated daily on week days.
Initial download of the metrics may take a while.