Fig. 1
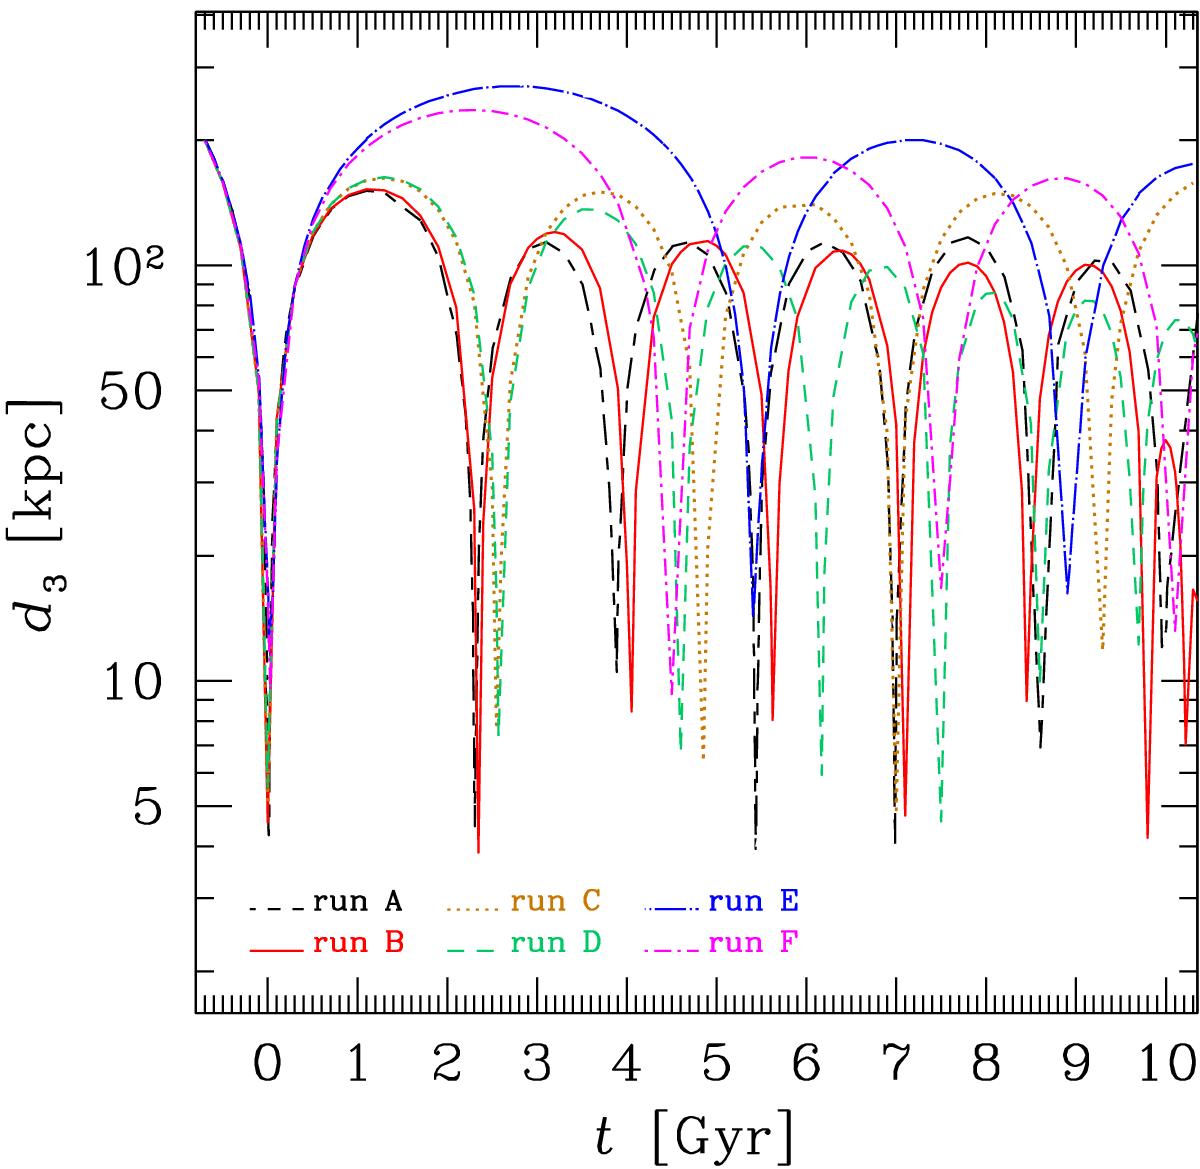
Radial distance of the satellite galaxy from the centre of the primary galaxy for all simulations, as a function of time. Time t = 0 corresponds to the first periapsis passage. Long-short dashed black line: run A; solid red line: run B; dotted ochre line: run C; dashed green line: run D; long-dash-dotted blue line: run E; short-dash-dotted magenta line: run F.
Current usage metrics show cumulative count of Article Views (full-text article views including HTML views, PDF and ePub downloads, according to the available data) and Abstracts Views on Vision4Press platform.
Data correspond to usage on the plateform after 2015. The current usage metrics is available 48-96 hours after online publication and is updated daily on week days.
Initial download of the metrics may take a while.