Free Access
Fig. 6
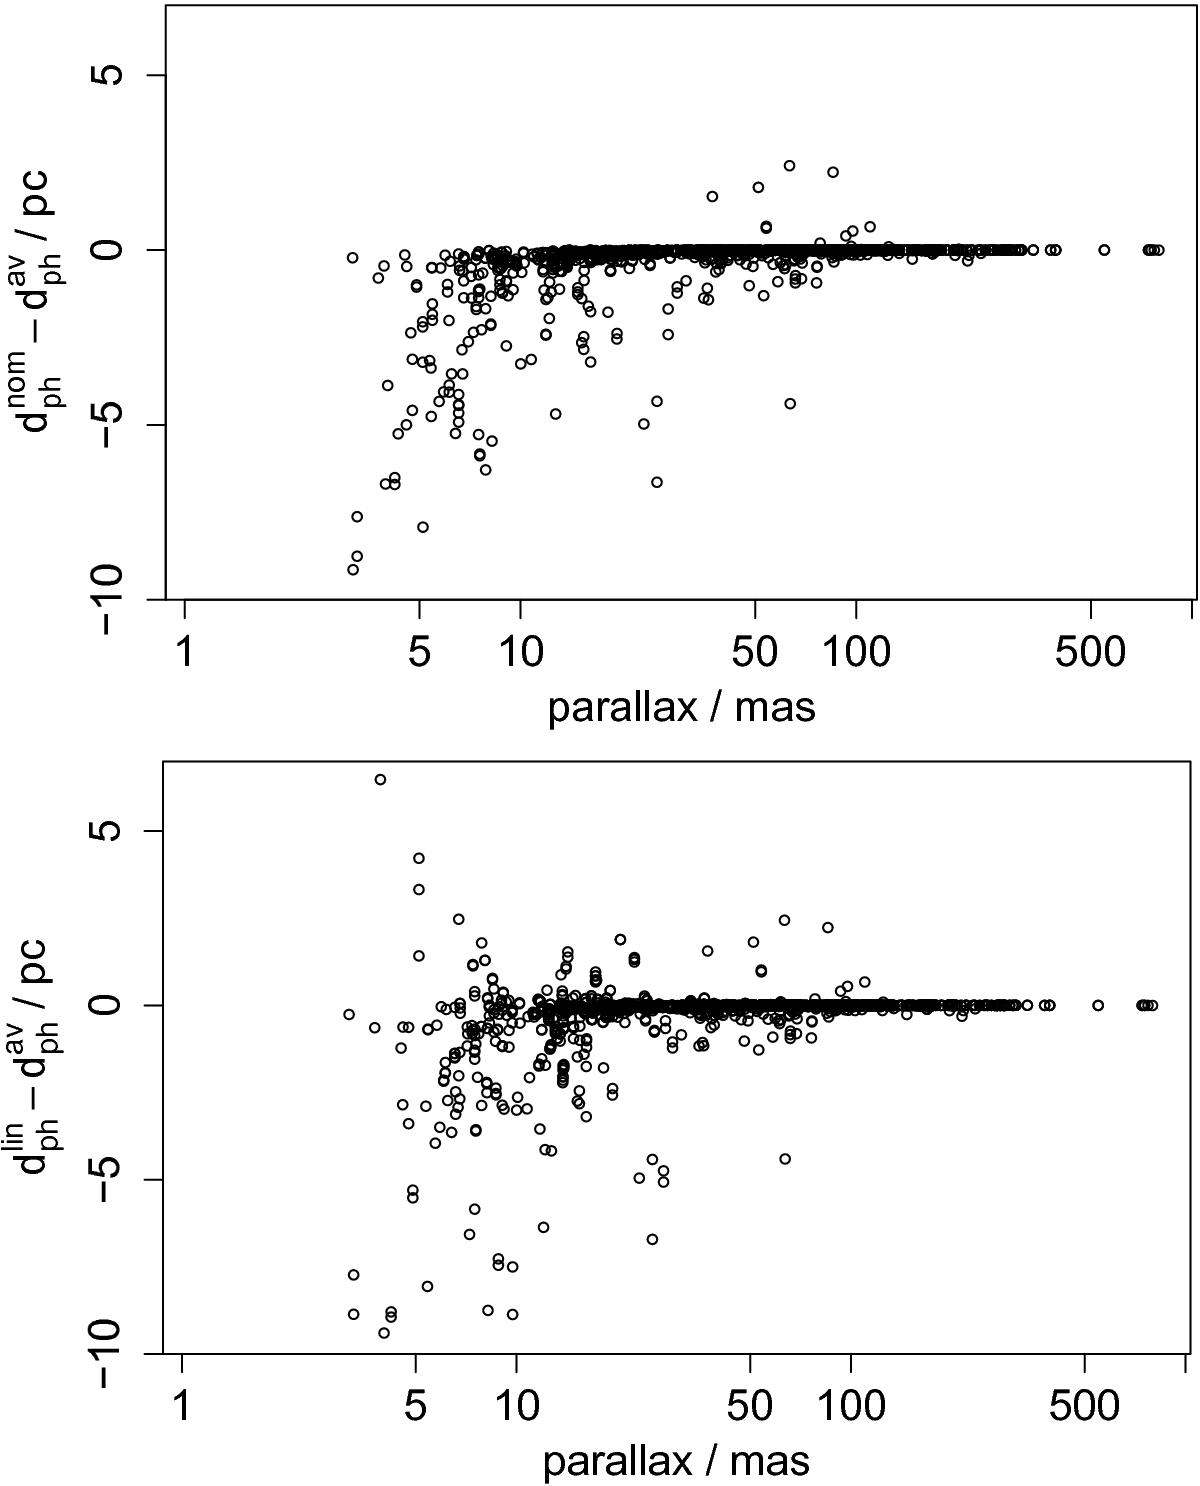
Difference between the nominal and mean perihelion distance estimates (top), and linear approximation and mean (bottom), as a function of the parallax on a logarithmic scale. 70 objects with ![]() pc and 81 objects with
pc and 81 objects with ![]() pc are not shown in the top and bottom panels respectively. A zoom is shown in Fig. 7.
pc are not shown in the top and bottom panels respectively. A zoom is shown in Fig. 7.
This figure is made of several images, please see below:
Current usage metrics show cumulative count of Article Views (full-text article views including HTML views, PDF and ePub downloads, according to the available data) and Abstracts Views on Vision4Press platform.
Data correspond to usage on the plateform after 2015. The current usage metrics is available 48-96 hours after online publication and is updated daily on week days.
Initial download of the metrics may take a while.