Fig. 4
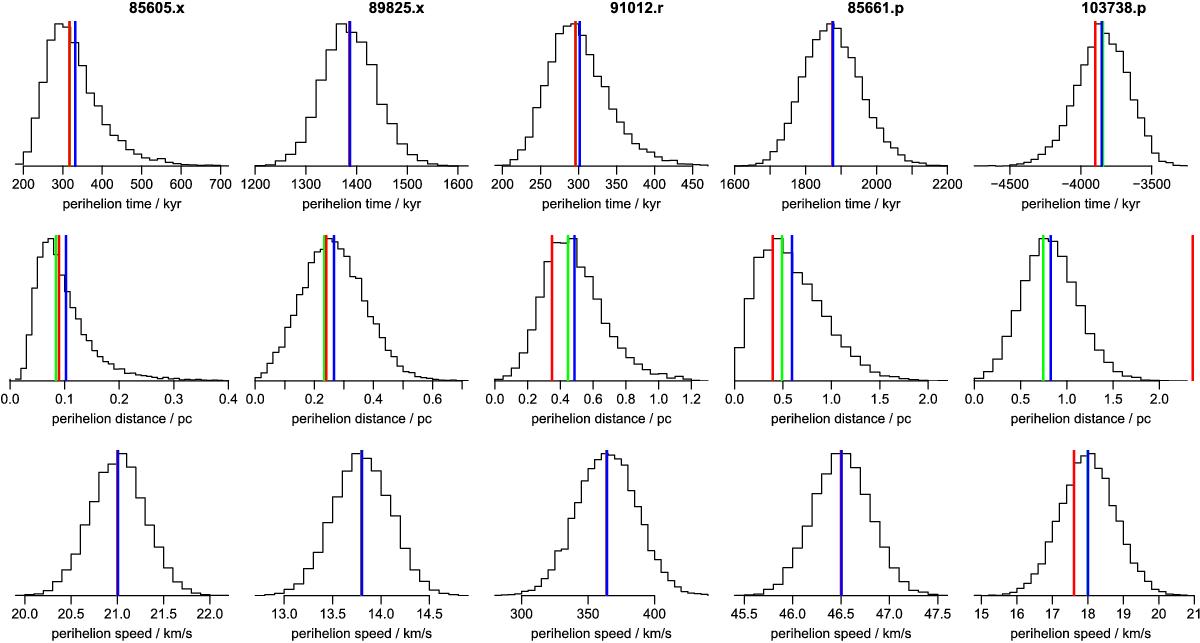
Distribution of the perihelion parameters from the resampled data for five selected objects (columns). Rows from top to bottom: tph, dph, vph. The vertical coloured bars show the three perihelion estimates discussed: the mean of the distribution (blue); the perihelion parameter obtained from using the nominal data (green); the perihelion parameter obtained from the linear approximation method (red). These are sometimes invisible as they coincide with other lines.
Current usage metrics show cumulative count of Article Views (full-text article views including HTML views, PDF and ePub downloads, according to the available data) and Abstracts Views on Vision4Press platform.
Data correspond to usage on the plateform after 2015. The current usage metrics is available 48-96 hours after online publication and is updated daily on week days.
Initial download of the metrics may take a while.