Fig. 18
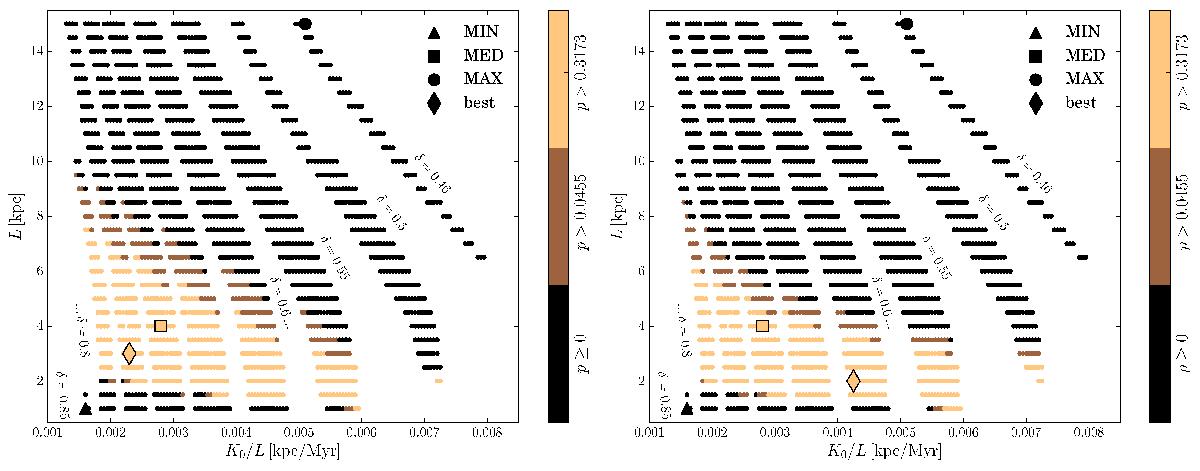
For each transport parameter set, represented in the K0/L – L plane, the best p-value distributions of all the 12 channels (five pulsars) are shown in the left (right) panel. The colour coding represents the increasing p-value from darker to lighter colours. The benchmark models MIN, MED, and MAX are represented with a triangle, square, and circle symbol, respectively. In addition, the best transport parameter set is highlighted with a diamond symbol.
Current usage metrics show cumulative count of Article Views (full-text article views including HTML views, PDF and ePub downloads, according to the available data) and Abstracts Views on Vision4Press platform.
Data correspond to usage on the plateform after 2015. The current usage metrics is available 48-96 hours after online publication and is updated daily on week days.
Initial download of the metrics may take a while.