Fig. 15
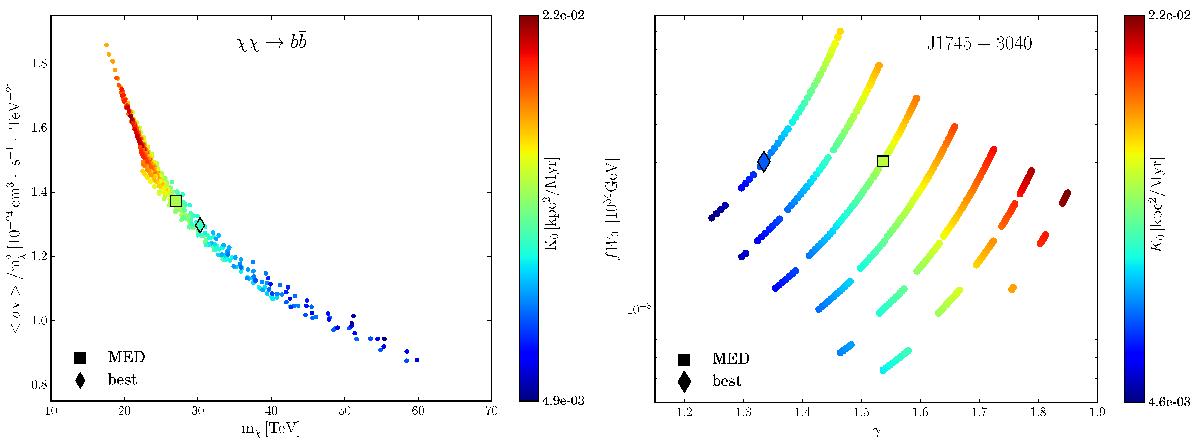
Surviving transport parameter sets’ K0 distributions for the DM ![]() (left panel) and the pulsar { γ,fW0 } (right panel) parameters. The colour coding represents the increasing K0 value from blue to red. The benchmark model MED is represented with a square. In addition, the best transport parameter set is highlighted with a diamond symbol.
(left panel) and the pulsar { γ,fW0 } (right panel) parameters. The colour coding represents the increasing K0 value from blue to red. The benchmark model MED is represented with a square. In addition, the best transport parameter set is highlighted with a diamond symbol.
Current usage metrics show cumulative count of Article Views (full-text article views including HTML views, PDF and ePub downloads, according to the available data) and Abstracts Views on Vision4Press platform.
Data correspond to usage on the plateform after 2015. The current usage metrics is available 48-96 hours after online publication and is updated daily on week days.
Initial download of the metrics may take a while.