Fig. 10
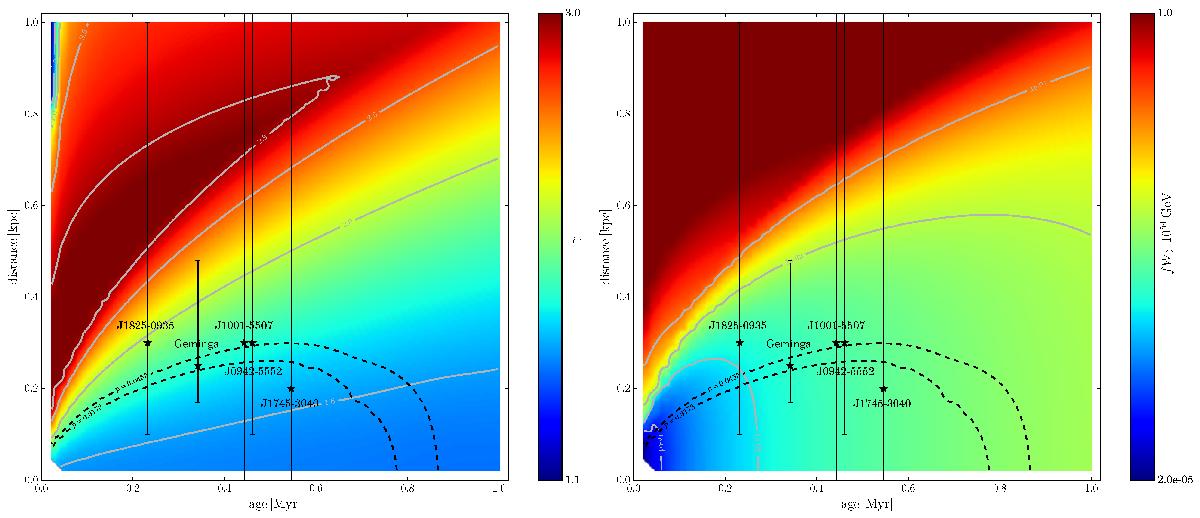
Best-fit values of the spectral index γ (left panel) and the total energy carried by positrons fW0 (right panel) for each point of the plane (age, distance) with the benchmark propagation model MED. The grey lines display the iso-contours for given values of γ (left) and fW0 (right). The black dashed lines represent the iso-contours of the critical p-values. The five selected pulsars with their associated uncertainty on their distance are indicated by the black stars.
Current usage metrics show cumulative count of Article Views (full-text article views including HTML views, PDF and ePub downloads, according to the available data) and Abstracts Views on Vision4Press platform.
Data correspond to usage on the plateform after 2015. The current usage metrics is available 48-96 hours after online publication and is updated daily on week days.
Initial download of the metrics may take a while.