Fig. 1
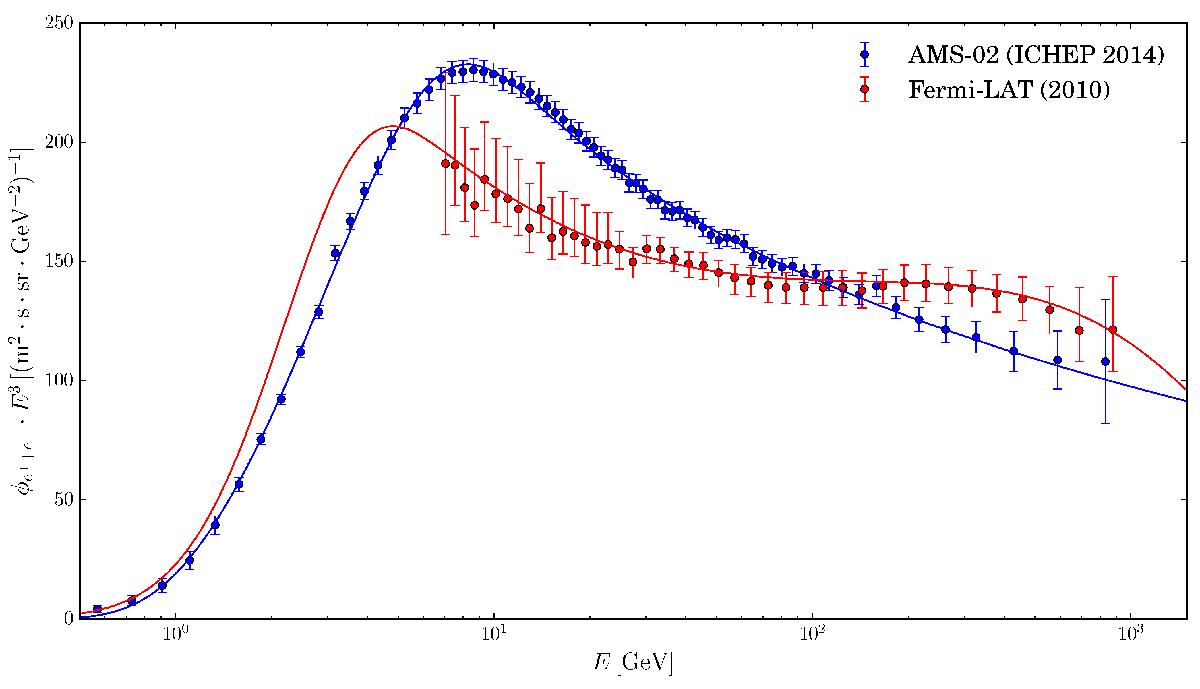
Lepton flux ΦL = Φe+ + Φe− is plotted as a function of the energy E. We included a rescaling factor of E3 to make clear the power-law behaviour of the flux at high energy. The red points correspond to the Fermi-LAT data(Ackermann et al. 2010) whereas the blue ones stand for the more recent measurements by AMS-02 presented at the ICHEP 2014 conference (Weng et al. 2014). The lines are fits to the data.
Current usage metrics show cumulative count of Article Views (full-text article views including HTML views, PDF and ePub downloads, according to the available data) and Abstracts Views on Vision4Press platform.
Data correspond to usage on the plateform after 2015. The current usage metrics is available 48-96 hours after online publication and is updated daily on week days.
Initial download of the metrics may take a while.