Free Access
Fig. 6
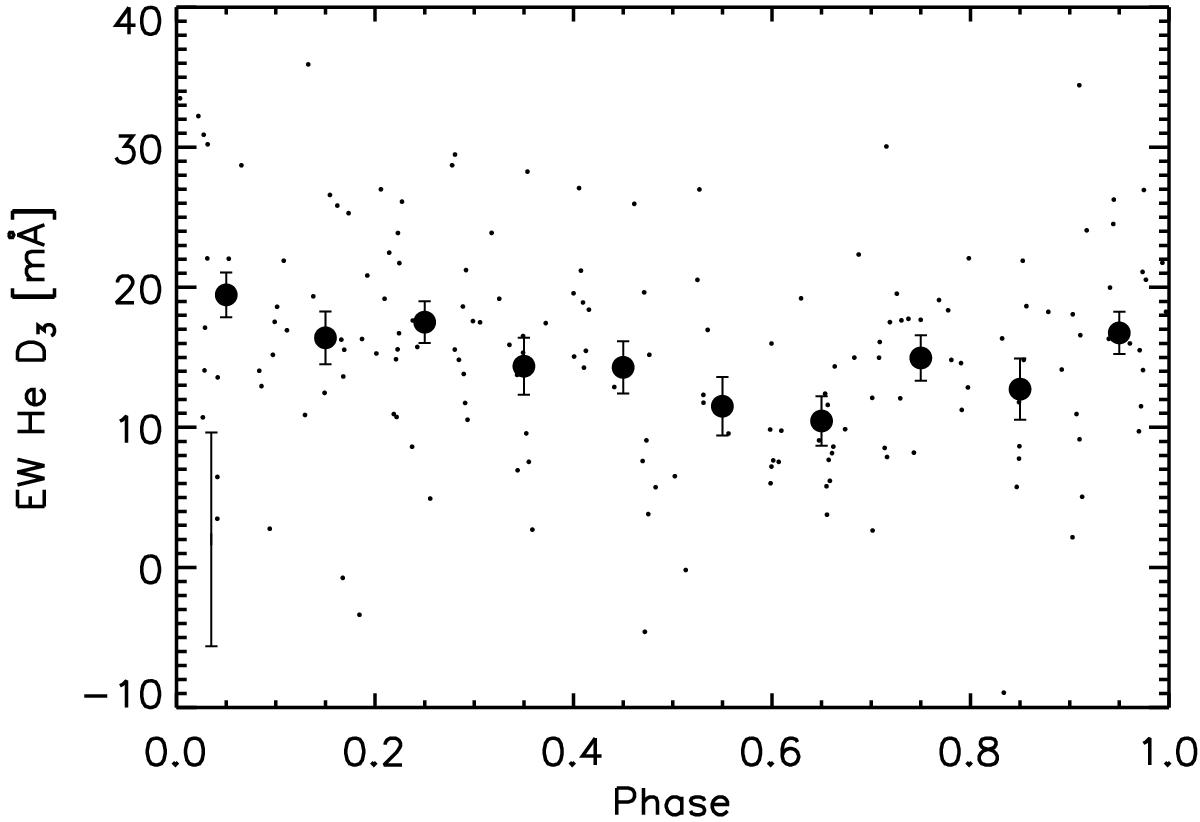
Rotational modulation of the He i D3 equivalent width. Measurements from single spectra are shown as small dots, while their phase-averaged values are indicated as large dots. The average error bar of single measurements is given in the lower left corner.
Current usage metrics show cumulative count of Article Views (full-text article views including HTML views, PDF and ePub downloads, according to the available data) and Abstracts Views on Vision4Press platform.
Data correspond to usage on the plateform after 2015. The current usage metrics is available 48-96 hours after online publication and is updated daily on week days.
Initial download of the metrics may take a while.