Fig. 9
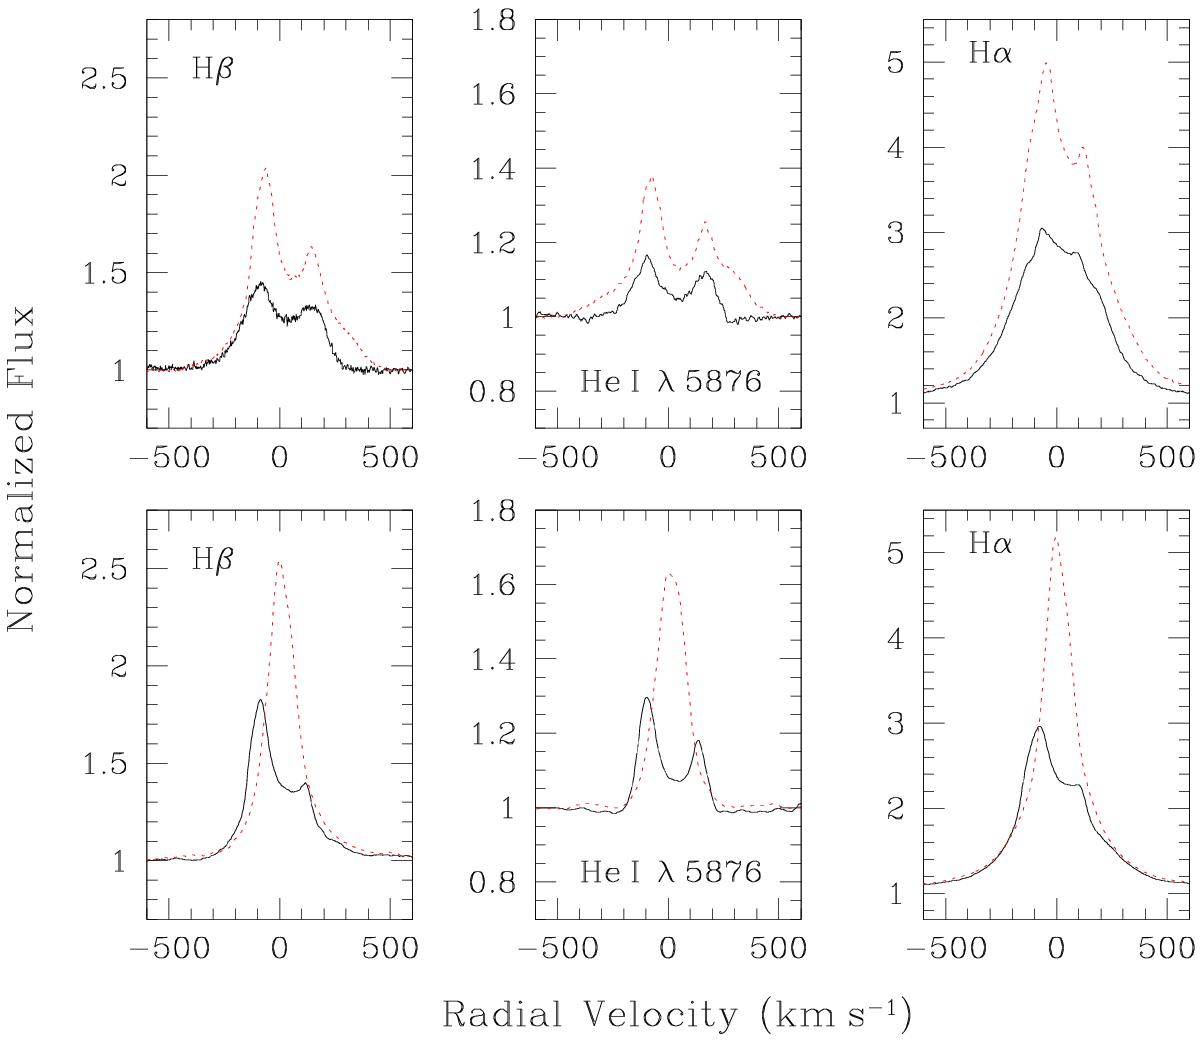
Line profile variations of HD 45 314 between minimum and maximum emission at different epochs. The top row illustrates the variations in the spectrum between 7 May 2000 (black solid line, HJD 2 451 672.5) and 5 March 2002 (red dotted line, HJD 2 452 338.5). The bottom row yields the spectra as observed on 28 September 2013 (black solid line, HJD 2 456 564.0) and 20 December 2013 (red dotted line, HJD 2 456 646.9).
Current usage metrics show cumulative count of Article Views (full-text article views including HTML views, PDF and ePub downloads, according to the available data) and Abstracts Views on Vision4Press platform.
Data correspond to usage on the plateform after 2015. The current usage metrics is available 48-96 hours after online publication and is updated daily on week days.
Initial download of the metrics may take a while.