Fig. A.1
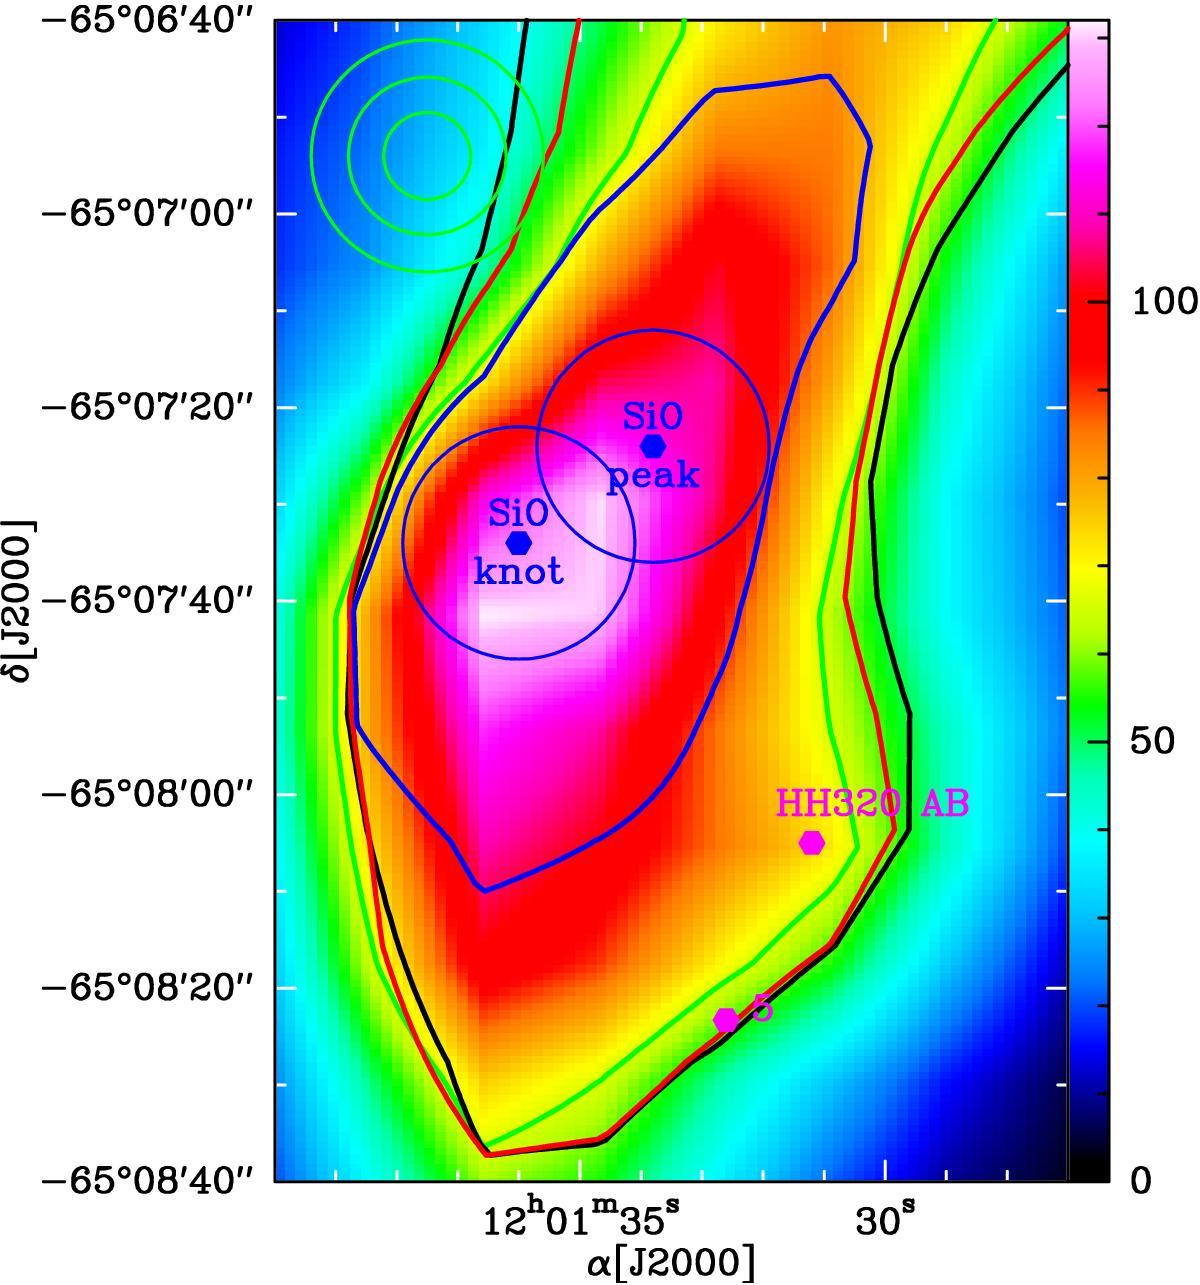
Same field as in Fig. 2, shown in CO (6−5) (colours) convolved at the 24′′ resolution. The half-maximum contours of the emission of the CO (3−2) (black line), (4–3) (red), (6–5) (green), and (7–6) (blue) lines is also shown at the same 24′′ resolution. The SiO peak and knot, HH320 AB and knot 5 positions, as well as the beam sizes of the (6–5), (16–15) and (11–10) transitions are also indicated as in Fig. 2.
Current usage metrics show cumulative count of Article Views (full-text article views including HTML views, PDF and ePub downloads, according to the available data) and Abstracts Views on Vision4Press platform.
Data correspond to usage on the plateform after 2015. The current usage metrics is available 48-96 hours after online publication and is updated daily on week days.
Initial download of the metrics may take a while.