Fig. 8
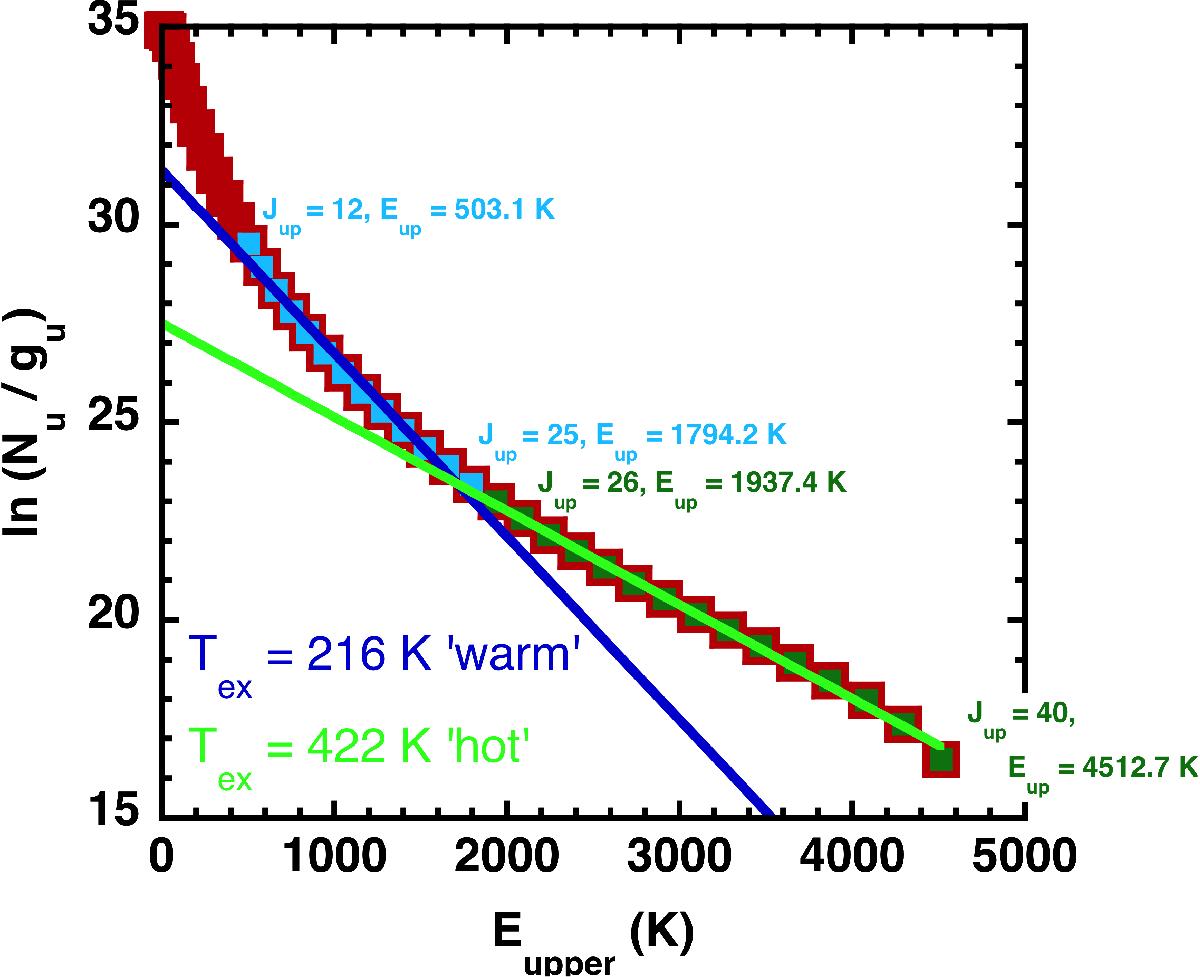
The CO excitation diagram produced from our best-fit model (red squares). Two temperature components can be fitted to our shock model over the PACS range of observations: a warm component (Tex = 216 K, dark blue line) fitting the level populations for Jup = 12 to 25 (light blue squares), and a hot component (Tex = 422 K, light green line) fitting the level populations for Jup = 26 to 40 (dark green squares).
Current usage metrics show cumulative count of Article Views (full-text article views including HTML views, PDF and ePub downloads, according to the available data) and Abstracts Views on Vision4Press platform.
Data correspond to usage on the plateform after 2015. The current usage metrics is available 48-96 hours after online publication and is updated daily on week days.
Initial download of the metrics may take a while.