Fig. 7
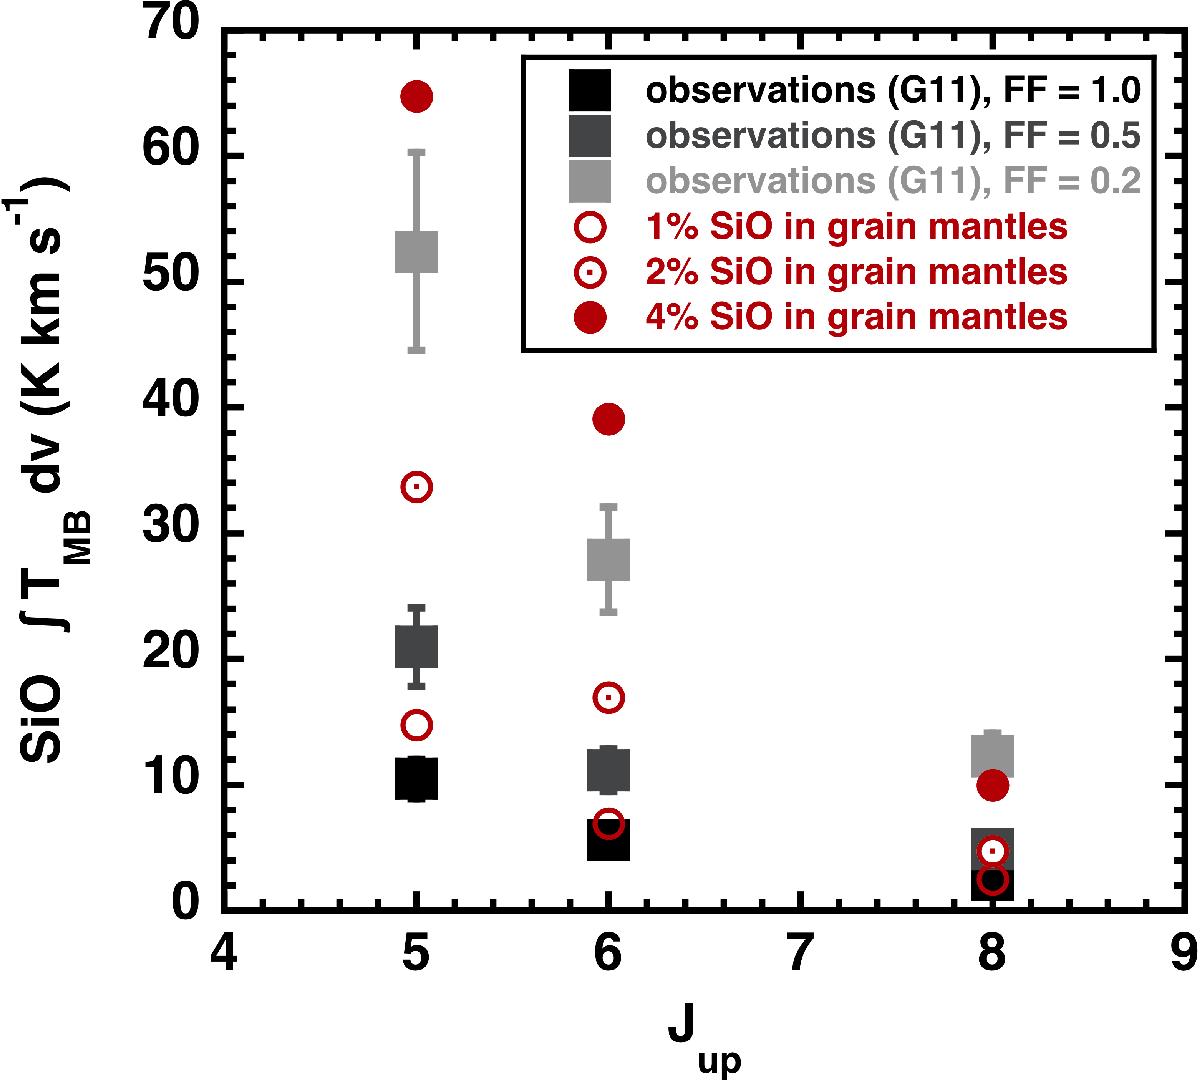
The integrated intensity diagram generated from the G11 observations of three SiO lines (Jup = 5, 6, 8), corrected for beam size and for filling factor effect: filling factor of 1, 0.5, and 0.2 in black, dark grey, and light grey squares. The result of our best-fit model for the H2 and CO lines (nH = 104 cm-3, b = 1.5, νs = 22 km s-1, and an age of 3800 years) is shown with 1, 2, or 4% of the pre-shock Si placed in the grain mantles in red empty, dotted, or filled circles.
Current usage metrics show cumulative count of Article Views (full-text article views including HTML views, PDF and ePub downloads, according to the available data) and Abstracts Views on Vision4Press platform.
Data correspond to usage on the plateform after 2015. The current usage metrics is available 48-96 hours after online publication and is updated daily on week days.
Initial download of the metrics may take a while.