Fig. 6
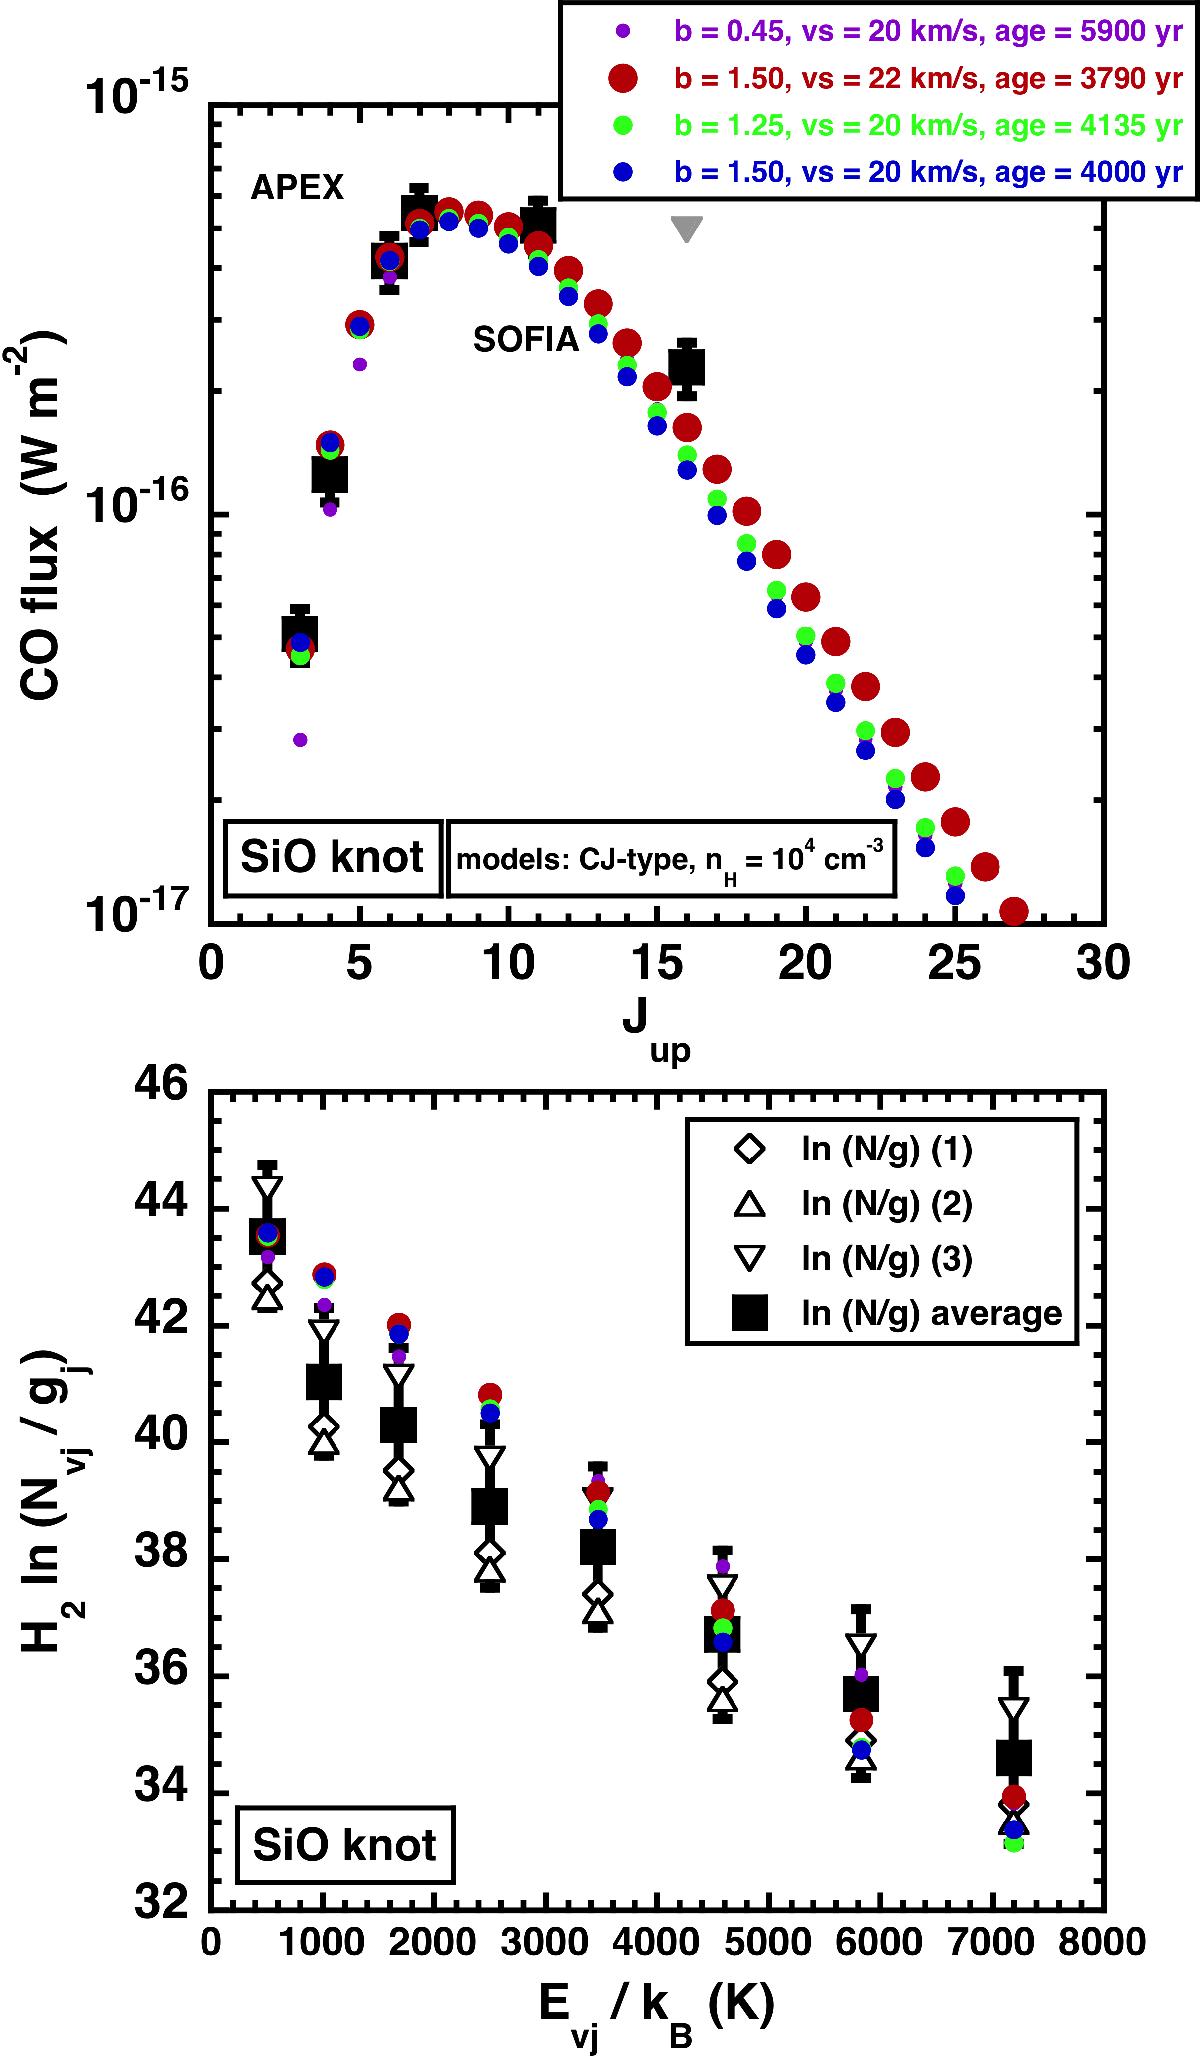
Our model-observations comparisons. Upper panel: CO flux diagram over a beam of 24′′; the observations in the SiO knot position are the black squares, and the model results are the coloured circles (see text). The CO (16−15) observational point is corrected for beam-size effect. The uncorrected point is the upper limit (see text), indicated by the grey arrow in this panel. Lower panel: H2 excitation diagram for the SiO knot position, extracted following the different procedures described in the text (empty symbols), global average in black squares, and model results in coloured circles (see text, with the same code as in the upper panel).
Current usage metrics show cumulative count of Article Views (full-text article views including HTML views, PDF and ePub downloads, according to the available data) and Abstracts Views on Vision4Press platform.
Data correspond to usage on the plateform after 2015. The current usage metrics is available 48-96 hours after online publication and is updated daily on week days.
Initial download of the metrics may take a while.