Fig. 5
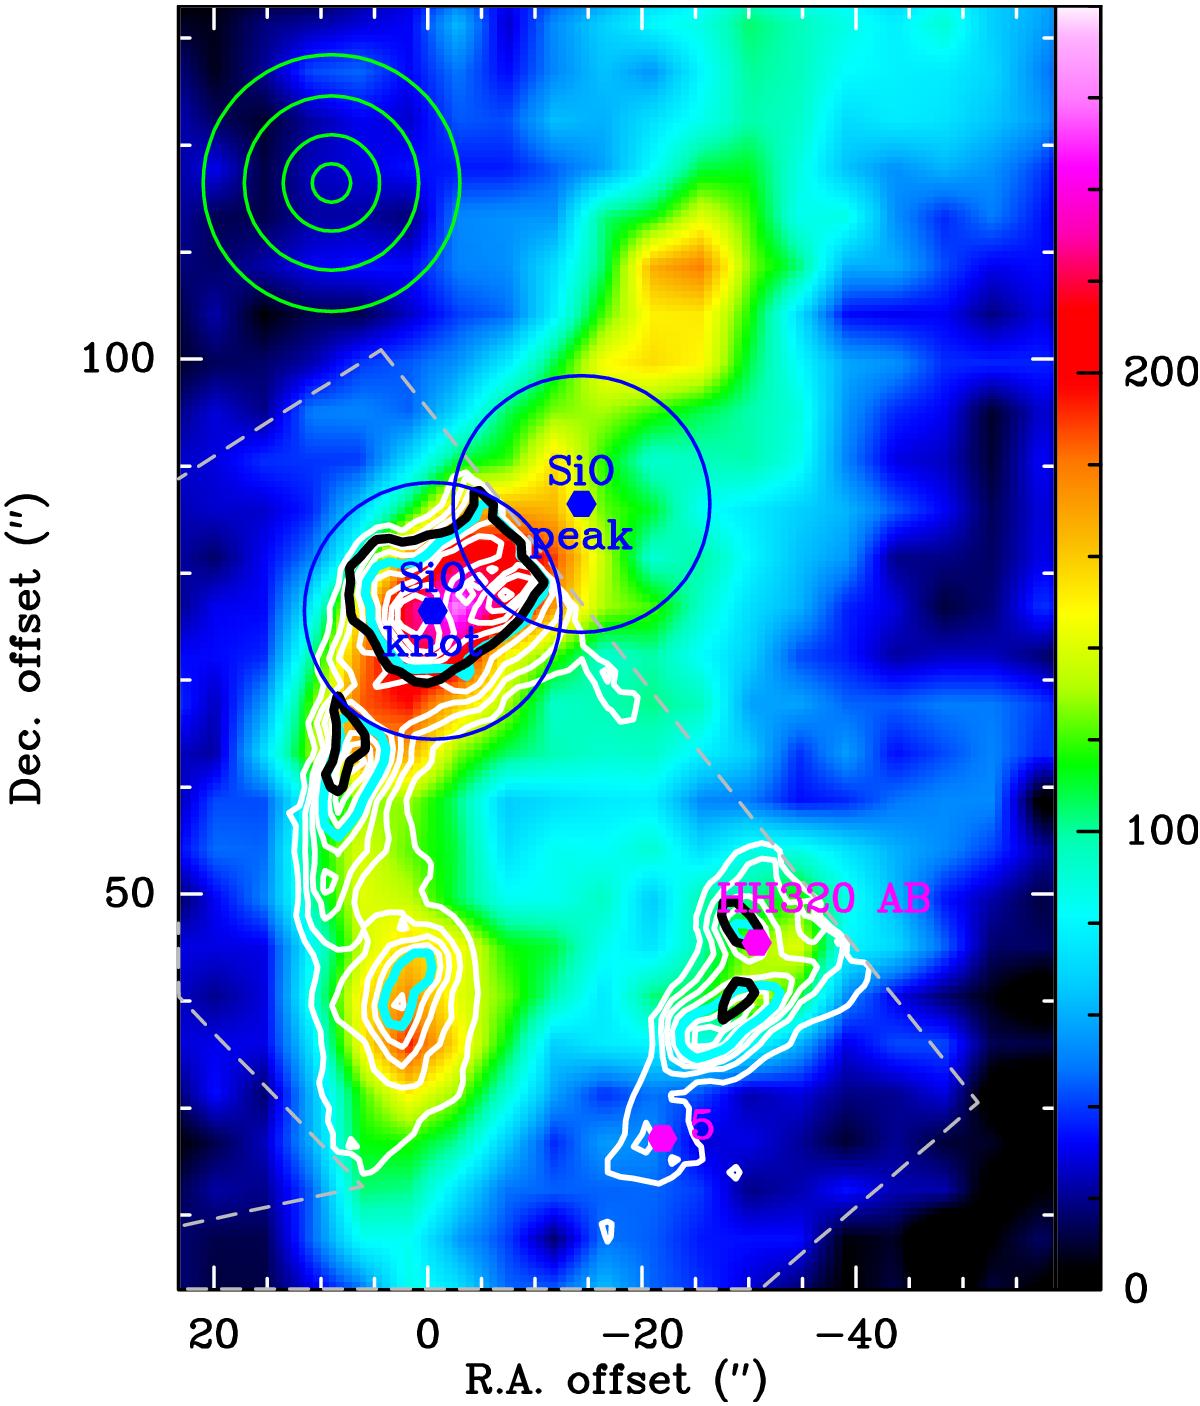
Overlay of the map of CO (6–5) emission observed by the APEX telescope (colour background) with the H2 0–0 S(5) emission (white contours), observed with the Spitzer telescope. The wedge unit is K km s-1 (main beam temperature) and refers to the CO observations. The H2 0–0 S(5) contours are from 10% to 100%, in steps of 10%. The light blue contour defines the half-maximum contour of this transition. Like in Fig. 2, the blue circles and dots indicate the positions and beam sizes of the SOFIA/GREAT observations. The beam and pixel sizes of the CO (6–5) (11–10), (16–15), and H2 0–0 S(5) observations are the green circles in the upper left corner. The black contour delineates the half-maximum contour of the H2 0–0 S(2) transition. The field is the same as in Fig. 2, and the knot 5 and HH320 region are in pink. The field covered by Spitzer/IRS to observe the H2 emission is indicated in dashed grey line. It excludes the SiO peak position.
Current usage metrics show cumulative count of Article Views (full-text article views including HTML views, PDF and ePub downloads, according to the available data) and Abstracts Views on Vision4Press platform.
Data correspond to usage on the plateform after 2015. The current usage metrics is available 48-96 hours after online publication and is updated daily on week days.
Initial download of the metrics may take a while.