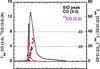
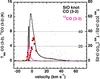
Fig. 4
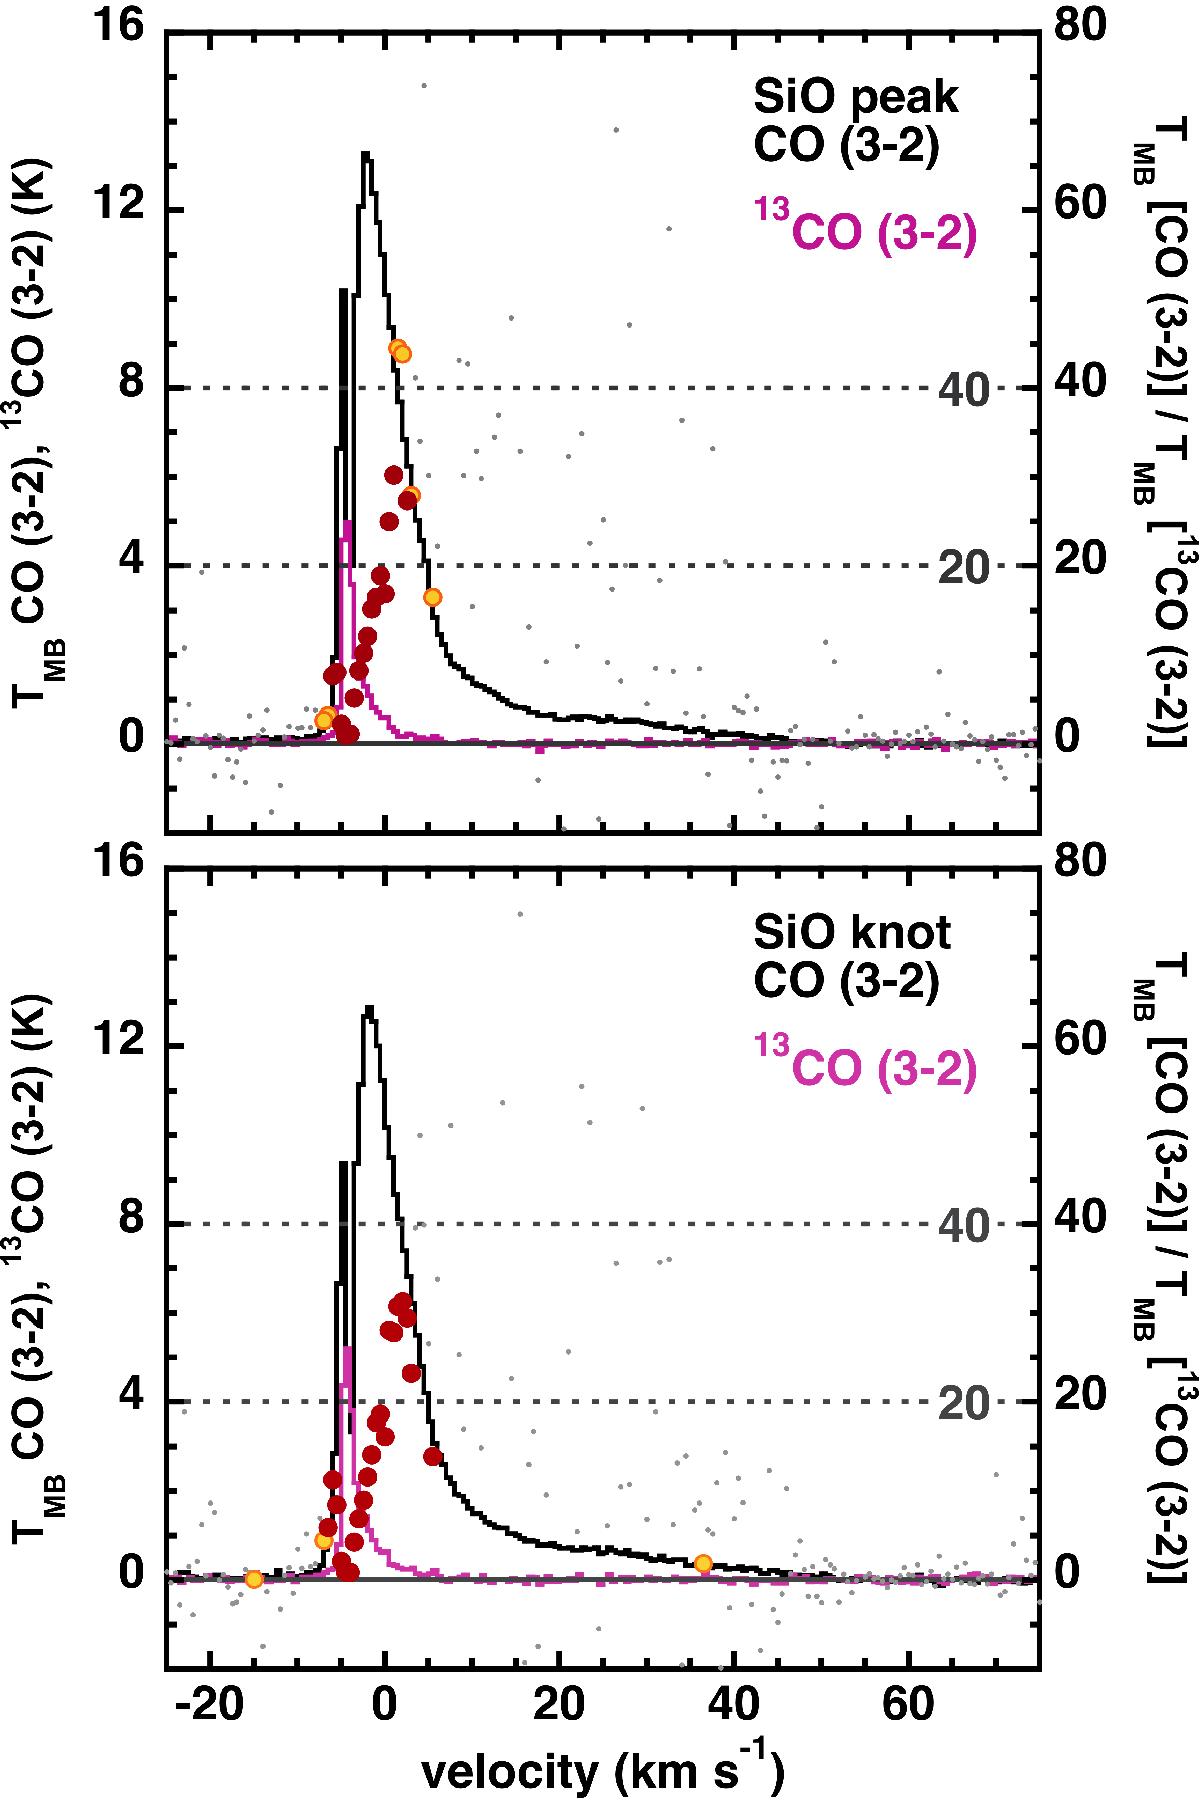
Comparison of the 12CO (black line) and 13CO (pink line) (3−2) emission profiles obtained in the SiO peak (upper panel) and knot (lower panel) positions. The ratio of main-beam temperatures is also shown in the form of red dots (for the channels where the 13CO detection is over 3σ), orange dots (for the channels where the 13CO detection is between 2 and 3σ), and grey dots (for the remaining channels). Associated with this distribution are the grey horizontal dotted lines, which show values of 20 and 40 for this ratio.
Current usage metrics show cumulative count of Article Views (full-text article views including HTML views, PDF and ePub downloads, according to the available data) and Abstracts Views on Vision4Press platform.
Data correspond to usage on the plateform after 2015. The current usage metrics is available 48-96 hours after online publication and is updated daily on week days.
Initial download of the metrics may take a while.