Fig. 3
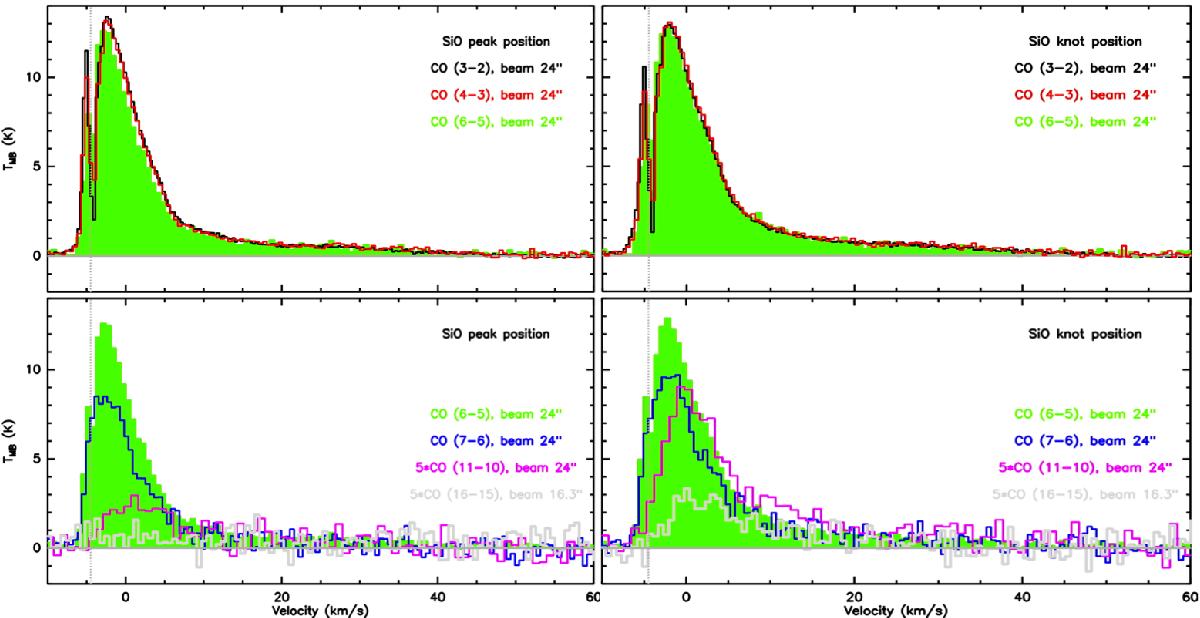
CO transitions in the SiO peak (left panels) and knot (right panels) positions indicated in Fig. 2: APEX (3–2), black line; (4–3), red line; (6–5), green line and histograms (upper panels); (7–6), dark blue lines; SOFIA (11–10), pink lines and (16–15), grey lines (lower panels, overlaid on the green histograms of the 6–5 transition). The last two were multiplied by five for comparison purposes. Respective spectral resolutions are 0.33, 0.50, 0.64, 0.54, 0.90 and 0.62 km s-1. The vertical dotted line marks the cloud velocity, −4.5 km s-1 (Bourke et al. 1995b).
Current usage metrics show cumulative count of Article Views (full-text article views including HTML views, PDF and ePub downloads, according to the available data) and Abstracts Views on Vision4Press platform.
Data correspond to usage on the plateform after 2015. The current usage metrics is available 48-96 hours after online publication and is updated daily on week days.
Initial download of the metrics may take a while.